Cancel OK

DAT Truckload Volume Index: January cold leads to spot-market surge

dat van january 2024

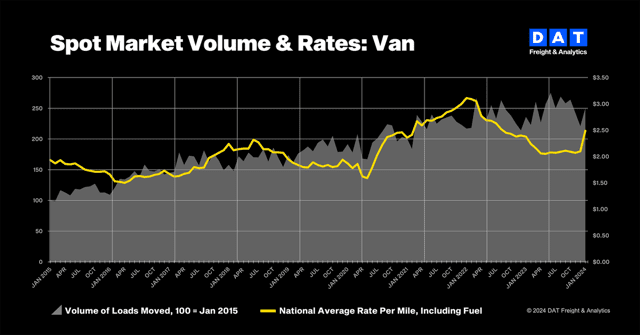
BEAVERTON, Ore., Feb. 14, 2024—A weather-related bump in demand for truckload capacity pushed spot freight volumes to all-time highs for January, reported DAT Freight & Analytics, which operates the DAT One online freight marketplace and DAT iQ data analytics service.

All three equipment types in the DAT Truckload Volume Index (TVI), a measure of loads moved in a month, increased compared to December:
• Van TVI: 250, up 11% month over month and 6% higher year over year
• Refrigerated TVI: 206, up 14% month over month and 1% year over year
• Flatbed TVI: 232, up 11% month over month and 6% year over year

“Winter weather increased the need for trucks at a time when shippers were moving holiday returns and springtime retail goods through supply chains, and for-hire carriers were rejecting a higher percentage of contracted loads,” said Ken Adamo, DAT Chief of Analytics. “This was not a case of freight volumes sustainably trending higher. Barring some other disruptive event, we expect demand for truckload capacity to meet seasonal expectations during the months ahead.”

Weather drove demand for trucks
Load-to-truck ratios, which measure the number of loads posted to the DAT One marketplace relative to the number of trucks, increased for all three equipment types:
• Van ratio: 2.7, up from 1.9 in December
• Reefer ratio: 4.1, up from 2.6
• Flatbed ratio: 8.3, up from 5.1

Ratios peaked in the middle of the month when a snap of winter weather snarled transportation across much of the country and pushed more loads to the spot market. They fell as conditions normalized and closed the month in line with December averages. Low ratios signal weak negotiating power for truckload carriers. Changes in the ratio often signal impending changes in rates.

Reefer rates jumped
Demand for trucks on the spot market pushed broker-to-carrier rates higher. The van rate was $2.14 per mile, up 4 cents compared to December, while the reefer rate jumped 10 cents to $2.57 a mile. The flatbed rate rose 6 cents to $2.47 a mile. Year over year, average spot rates were down 24 cents for vans, 21 cents for reefers, and 29 cents for flatbeds.

Line-haul rates, which subtract an amount equal to an average fuel surcharge, strengthened further:
• Line-haul van rate: $1.71 per mile, up 6 cents compared to December
• Line-haul reefer rate: $2.10 a mile, up 12 cents
• Line-haul flatbed rate: $1.95, up 8 cents

Last month’s rates were substantially higher than in January 2020, before the supply chain disruptions of the pandemic. At that time, the benchmark van line-haul rate was $1.57 per mile, the reefer rate was $1.91 a mile, and the flatbed rate was $1.81 a mile.

Demand for spot reefer equipment increases during cold snaps as shippers look for ways to protect van freight from freezing.

Rates for contracted van and reefer freight were unchanged month over month. DAT’s benchmark contract van rate was $2.49 a mile, and the reefer rate was $2.57. The flatbed rate declined 4 cents to $3.10, the lowest monthly average since May 2021.

The gap between spot and contract rates narrowed compared to December. It was 35 cents for van freight, down 4 cents; 31 cents for reefer loads, down 10 cents; and 63 cents for flatbeds, also down 10 cents.

About the DAT Truckload Volume Index
The DAT Truckload Volume Index reflects the change in the number of loads with a pickup date during that month. A baseline of 100 equals the number of loads moved in January 2015, as recorded in DAT RateView, a truckload pricing database and analysis tool with rates paid on an average of 3 million loads per month.

Load-to-truck ratios measure the number of loads posted to the DAT One marketplace relative to the number of trucks. DAT benchmark spot rates are derived from invoice data for hauls of 250 miles or more with a reported pickup date during the month. Line-haul rates subtract an amount equal to an average fuel surcharge.

About DAT Freight & Analytics
DAT Freight & Analytics operates the largest truckload freight marketplace in North America. Shippers, transportation brokers, carriers, news organizations, and industry analysts rely on DAT for trends and data insights based on more than 400 million freight matches and a database of $150 billion in annual market transactions.

Founded in 1978, DAT is a business unit of Roper Technologies (Nasdaq: ROP), a constituent of the Nasdaq 100, S&P 500, and Fortune 1000.

Contact
Annabel Reeves
Corporate Communications, DAT Freight & Analytics
PR@dat.com / annabel.reeves@dat.com; 503-501-0143

Twitter

BEAVERTON, Ore., Feb. 14, 2024—A weather-related bump in demand for truckload capacity pushed spot freight volumes to all-time highs for January, reported DAT Freight & Analytics, which operates the DAT One online freight marketplace and DAT iQ data analytics service.

All three equipment types in the DAT Truckload Volume Index (TVI), a measure of loads moved in a month, increased compared to December:
• Van TVI: 250, up 11% month over month and 6% higher year over year
• Refrigerated TVI: 206, up 14% month over month and 1% year over year
• Flatbed TVI: 232, up 11% month over month and 6% year over year

“Winter weather increased the need for trucks at a time when shippers were moving holiday returns and springtime retail goods through supply chains, and for-hire carriers were rejecting a higher percentage of contracted loads,” said Ken Adamo, DAT Chief of Analytics. “This was not a case of freight volumes sustainably trending higher. Barring some other disruptive event, we expect demand for truckload capacity to meet seasonal expectations during the months ahead.”

Weather drove demand for trucks
Load-to-truck ratios, which measure the number of loads posted to the DAT One marketplace relative to the number of trucks, increased for all three equipment types:
• Van ratio: 2.7, up from 1.9 in December
• Reefer ratio: 4.1, up from 2.6
• Flatbed ratio: 8.3, up from 5.1

Ratios peaked in the middle of the month when a snap of winter weather snarled transportation across much of the country and pushed more loads to the spot market. They fell as conditions normalized and closed the month in line with December averages. Low ratios signal weak negotiating power for truckload carriers. Changes in the ratio often signal impending changes in rates.

Reefer rates jumped
Demand for trucks on the spot market pushed broker-to-carrier rates higher. The van rate was $2.14 per mile, up 4 cents compared to December, while the reefer rate jumped 10 cents to $2.57 a mile. The flatbed rate rose 6 cents to $2.47 a mile. Year over year, average spot rates were down 24 cents for vans, 21 cents for reefers, and 29 cents for flatbeds.

Line-haul rates, which subtract an amount equal to an average fuel surcharge, strengthened further:
• Line-haul van rate: $1.71 per mile, up 6 cents compared to December
• Line-haul reefer rate: $2.10 a mile, up 12 cents
• Line-haul flatbed rate: $1.95, up 8 cents

Last month’s rates were substantially higher than in January 2020, before the supply chain disruptions of the pandemic. At that time, the benchmark van line-haul rate was $1.57 per mile, the reefer rate was $1.91 a mile, and the flatbed rate was $1.81 a mile.

Demand for spot reefer equipment increases during cold snaps as shippers look for ways to protect van freight from freezing.

Rates for contracted van and reefer freight were unchanged month over month. DAT’s benchmark contract van rate was $2.49 a mile, and the reefer rate was $2.57. The flatbed rate declined 4 cents to $3.10, the lowest monthly average since May 2021.

The gap between spot and contract rates narrowed compared to December. It was 35 cents for van freight, down 4 cents; 31 cents for reefer loads, down 10 cents; and 63 cents for flatbeds, also down 10 cents.

About the DAT Truckload Volume Index
The DAT Truckload Volume Index reflects the change in the number of loads with a pickup date during that month. A baseline of 100 equals the number of loads moved in January 2015, as recorded in DAT RateView, a truckload pricing database and analysis tool with rates paid on an average of 3 million loads per month.

Load-to-truck ratios measure the number of loads posted to the DAT One marketplace relative to the number of trucks. DAT benchmark spot rates are derived from invoice data for hauls of 250 miles or more with a reported pickup date during the month. Line-haul rates subtract an amount equal to an average fuel surcharge.

About DAT Freight & Analytics
DAT Freight & Analytics operates the largest truckload freight marketplace in North America. Shippers, transportation brokers, carriers, news organizations, and industry analysts rely on DAT for trends and data insights based on more than 400 million freight matches and a database of $150 billion in annual market transactions.

Founded in 1978, DAT is a business unit of Roper Technologies (Nasdaq: ROP), a constituent of the Nasdaq 100, S&P 500, and Fortune 1000.

Contact
Annabel Reeves
Corporate Communications, DAT Freight & Analytics
PR@dat.com / annabel.reeves@dat.com; 503-501-0143
Twitter