Cancel OK

March online grocery sales drop nearly 8% as cost pressures mount

mercatus brick meets click online grocery march 2023 vs. yago

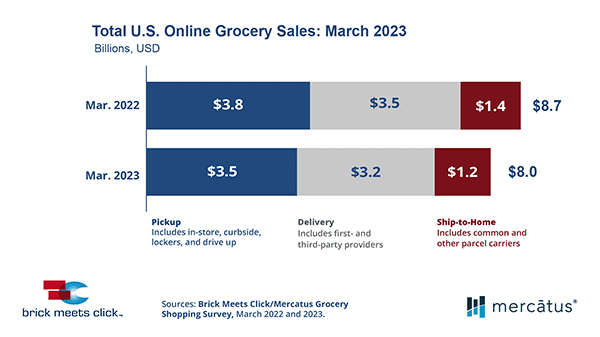
Barrington, Ill. – April 11, 2023 – The U.S. online grocery market in March posted $8.0 billion in total sales, down 7.6% compared to last year, according to the monthly Brick Meets Click/Mercatus Grocery Shopping Survey fielded March 30-31, 2023.  The year-over-year decline was driven by the large core eGrocery segments of Delivery and Pickup, which contracted 7.4% and 8.5% respectively, as well as Ship-to-Home which fell 5.9%.

Cost considerations are now the most important factor in determining where customers shop and how they receive online grocery orders. During March 2023, “cost” rose in importance by 300 basis points (bps) compared to a year ago, knocking “convenience” (defined as “getting the order when you want without delay”) out of the top spot. For the month, 44% of households that used a Pickup or Delivery service from a Grocery or Mass retailer indicated that not paying more than necessary was the most important criteria in selecting an online grocery service. 

“Lower income households are more attracted to Pickup services because it costs much less to use than Delivery, due to the additional charges, fees, and tips,” said David Bishop, Partner at Brick Meets Click. “During March 2023, households earning under $50,000 annually were 34% more likely to use Pickup while households making over $200,000 per year were over twice as likely to use Delivery.”

Given that the impact of grocery inflation is regressive, this helps set the stage for why, during March 2023 versus last year, households using Pickup reported a 420-bps rise relative to “cost” being the most important selection criteria while households using Delivery reported only a 140-bps gain for “cost.”

Another income-related factor that likely had a greater negative effect on Pickup sales than Delivery sales was the ongoing elimination of emergency SNAP benefits. March 2023 marked the first month that more than three-quarters of the households participating in SNAP lost the additional $95 per month in pandemic-related support to buy groceries, joining the balance of SNAP households who had lost this amount earlier. 

The average number of online grocery orders completed by monthly active users (MAUs) continued to decline from pandemic highs, whether due to ongoing attempts to stretch a dollar, further decline in concerns about respiratory infections, or a combination of factors. In March, monthly order frequency dropped to 2.42, the lowest level since COVID disrupted the way Americans shop for groceries in March 2020 although still nearly 20% above the pre-COVID measure.

Monthly order frequency for both Grocery and Mass declined in March, but the downward trend was more pronounced for Grocery. Order frequency dropped 10% among Grocery’s MAUs, whereas it dipped just 2% for Mass. While Mass customers are still more likely to consider “cost” the most important criteria in selecting a service, Grocery customers have become more cost conscious, and this shift may have contributed to the greater decline reported for Grocery.  

The persistent pressure for households to “stretch the dollar” likely strengthened the benefit to Grocery’s MAUs of also buying groceries online from a Mass retailer during the month. Overall, the cross-shopping rate stood at 28% for March, which was just 90 bps lower than a year ago, but there were notable differences between Grocery MAUs’ use of Walmart and Target. The cross-shop rate for Walmart remained essentially unchanged, while it fell 280 basis points for Target versus March 2022.

Repeat intent scores across the customer base trended down for the month of March. The likelihood that a customer will use the same service within the next 30 days finished at nearly 61%, down 290 bps compared to last year. First-time customers reported a significant year-over-year drop of 600 bps while the more-frequent customers (those who completed four or more orders with a service within the past three months) slipped by 220 bps. And, while the repeat intent with the highest-income MAUs stood at 69% in March, it fell steadily along with household income, finishing at 55% for the lowest-income households.

The online share of total grocery spending was also down in March, falling 160 basis points to 12.7% versus last year. Excluding Ship-to-Home, since most conventional supermarkets don’t offer it, the adjusted contribution from Pickup and Delivery dropped 130 basis points and finished at 10.6% for the month.

“Now is the time for conventional grocers to prioritize maintaining engagement with existing customers,” said Sylvain Perrier, president and CEO, Mercatus. “Proven ways of growing your online revenue hinge on providing a great customer experience, encouraging your more loyal customers to use frequently, and benefitting from positive word-of-mouth advocacy that will attract others to use your online services.”

Check out the Brick Meets Click eGrocery Dashboard for March 2023 or visit the eMarket/eShopper page for additional insights and information about the full report.

About this consumer research
The Brick Meets Click/Mercatus Grocery Shopping Survey is an ongoing independent research initiative created and conducted by Brick Meets Click and sponsored by Mercatus. Brick Meets Click conducted the survey on March 30-31, 2023, with 1,742 adults, 18 years and older, who participated in the household’s grocery shopping.

The three receiving methods for online grocery orders are defined as follows:

·       Delivery includes orders received from a first- or third-party provider like Instacart, Shipt or the retailer’s own employees.

·       Pickup includes orders that are received by customers either inside or outside a store or at a designated location/locker.

·       Ship-to-Home includes orders that are received via common or contract carriers like FedEx, UPS, USPS, etc.

Results were adjusted based on internet usage among U.S. adults to account for the non-response bias associated with online surveys. Responses are geographically representative of the U.S. and weighted by age to reflect the national population of adults, 18 years and older, according to the U.S. Census Bureau. Brick Meets Click used a similar methodology for each of the surveys conducted in 2023 – Feb. 26-27 (n=1,745); Jan. 30-31 (n=1,735); in 2022 – Dec. 28-29 (n=1,715), Nov. 29-30 (n=1,749), Oct. 28-29 (n=1,732), Sept. 29-30 (n=1,752), Aug. 29-30 (n=1,743), July 29-30 (n=1,690), June 29-30 (n=1,743), May 28-29 (n=1,802),  Apr. 28-29 (n=1,746), Mar. 28-29 (n=1,681), Feb. 26-27 (n=1,790), and Jan. 29-30 (n=1,793); in 2021 – Dec. 29-30 (n = 1,836), Nov. 29-30 (n=1,785), Oct. 29-30 (n=1,751), Sept. 28-29 (n=1,728), Aug. 29-30 (n=1,806), July 29-30 (n=1,892), June 27-28 (n=1,789), May 28-30 (n=1,872), Apr. 26-28 (n=1,941), Mar. 26-28 (n=1,811), Feb. 26-28 (n= 1,812), and Jan. 28-31 (n=1,776); in 2020 – Nov. 11-14 (n=2,067), Aug. 24-26 (n=1,817), Jun. 24-25 (n=1,781), May 20-22 (n=1,724), Apr. 22-24 (n= 1,651), and Mar. 23-25 (n=1,601); and in 2019 – Aug. 22-24 (n = 2,485).

Twitter

Barrington, Ill. – April 11, 2023 – The U.S. online grocery market in March posted $8.0 billion in total sales, down 7.6% compared to last year, according to the monthly Brick Meets Click/Mercatus Grocery Shopping Survey fielded March 30-31, 2023.  The year-over-year decline was driven by the large core eGrocery segments of Delivery and Pickup, which contracted 7.4% and 8.5% respectively, as well as Ship-to-Home which fell 5.9%.

Cost considerations are now the most important factor in determining where customers shop and how they receive online grocery orders. During March 2023, “cost” rose in importance by 300 basis points (bps) compared to a year ago, knocking “convenience” (defined as “getting the order when you want without delay”) out of the top spot. For the month, 44% of households that used a Pickup or Delivery service from a Grocery or Mass retailer indicated that not paying more than necessary was the most important criteria in selecting an online grocery service. 

“Lower income households are more attracted to Pickup services because it costs much less to use than Delivery, due to the additional charges, fees, and tips,” said David Bishop, Partner at Brick Meets Click. “During March 2023, households earning under $50,000 annually were 34% more likely to use Pickup while households making over $200,000 per year were over twice as likely to use Delivery.”

Given that the impact of grocery inflation is regressive, this helps set the stage for why, during March 2023 versus last year, households using Pickup reported a 420-bps rise relative to “cost” being the most important selection criteria while households using Delivery reported only a 140-bps gain for “cost.”

Another income-related factor that likely had a greater negative effect on Pickup sales than Delivery sales was the ongoing elimination of emergency SNAP benefits. March 2023 marked the first month that more than three-quarters of the households participating in SNAP lost the additional $95 per month in pandemic-related support to buy groceries, joining the balance of SNAP households who had lost this amount earlier. 

The average number of online grocery orders completed by monthly active users (MAUs) continued to decline from pandemic highs, whether due to ongoing attempts to stretch a dollar, further decline in concerns about respiratory infections, or a combination of factors. In March, monthly order frequency dropped to 2.42, the lowest level since COVID disrupted the way Americans shop for groceries in March 2020 although still nearly 20% above the pre-COVID measure.

Monthly order frequency for both Grocery and Mass declined in March, but the downward trend was more pronounced for Grocery. Order frequency dropped 10% among Grocery’s MAUs, whereas it dipped just 2% for Mass. While Mass customers are still more likely to consider “cost” the most important criteria in selecting a service, Grocery customers have become more cost conscious, and this shift may have contributed to the greater decline reported for Grocery.  

The persistent pressure for households to “stretch the dollar” likely strengthened the benefit to Grocery’s MAUs of also buying groceries online from a Mass retailer during the month. Overall, the cross-shopping rate stood at 28% for March, which was just 90 bps lower than a year ago, but there were notable differences between Grocery MAUs’ use of Walmart and Target. The cross-shop rate for Walmart remained essentially unchanged, while it fell 280 basis points for Target versus March 2022.

Repeat intent scores across the customer base trended down for the month of March. The likelihood that a customer will use the same service within the next 30 days finished at nearly 61%, down 290 bps compared to last year. First-time customers reported a significant year-over-year drop of 600 bps while the more-frequent customers (those who completed four or more orders with a service within the past three months) slipped by 220 bps. And, while the repeat intent with the highest-income MAUs stood at 69% in March, it fell steadily along with household income, finishing at 55% for the lowest-income households.

The online share of total grocery spending was also down in March, falling 160 basis points to 12.7% versus last year. Excluding Ship-to-Home, since most conventional supermarkets don’t offer it, the adjusted contribution from Pickup and Delivery dropped 130 basis points and finished at 10.6% for the month.

“Now is the time for conventional grocers to prioritize maintaining engagement with existing customers,” said Sylvain Perrier, president and CEO, Mercatus. “Proven ways of growing your online revenue hinge on providing a great customer experience, encouraging your more loyal customers to use frequently, and benefitting from positive word-of-mouth advocacy that will attract others to use your online services.”

Check out the Brick Meets Click eGrocery Dashboard for March 2023 or visit the eMarket/eShopper page for additional insights and information about the full report.

About this consumer research
The Brick Meets Click/Mercatus Grocery Shopping Survey is an ongoing independent research initiative created and conducted by Brick Meets Click and sponsored by Mercatus. Brick Meets Click conducted the survey on March 30-31, 2023, with 1,742 adults, 18 years and older, who participated in the household’s grocery shopping.

The three receiving methods for online grocery orders are defined as follows:

·       Delivery includes orders received from a first- or third-party provider like Instacart, Shipt or the retailer’s own employees.

·       Pickup includes orders that are received by customers either inside or outside a store or at a designated location/locker.

·       Ship-to-Home includes orders that are received via common or contract carriers like FedEx, UPS, USPS, etc.

Results were adjusted based on internet usage among U.S. adults to account for the non-response bias associated with online surveys. Responses are geographically representative of the U.S. and weighted by age to reflect the national population of adults, 18 years and older, according to the U.S. Census Bureau. Brick Meets Click used a similar methodology for each of the surveys conducted in 2023 – Feb. 26-27 (n=1,745); Jan. 30-31 (n=1,735); in 2022 – Dec. 28-29 (n=1,715), Nov. 29-30 (n=1,749), Oct. 28-29 (n=1,732), Sept. 29-30 (n=1,752), Aug. 29-30 (n=1,743), July 29-30 (n=1,690), June 29-30 (n=1,743), May 28-29 (n=1,802),  Apr. 28-29 (n=1,746), Mar. 28-29 (n=1,681), Feb. 26-27 (n=1,790), and Jan. 29-30 (n=1,793); in 2021 – Dec. 29-30 (n = 1,836), Nov. 29-30 (n=1,785), Oct. 29-30 (n=1,751), Sept. 28-29 (n=1,728), Aug. 29-30 (n=1,806), July 29-30 (n=1,892), June 27-28 (n=1,789), May 28-30 (n=1,872), Apr. 26-28 (n=1,941), Mar. 26-28 (n=1,811), Feb. 26-28 (n= 1,812), and Jan. 28-31 (n=1,776); in 2020 – Nov. 11-14 (n=2,067), Aug. 24-26 (n=1,817), Jun. 24-25 (n=1,781), May 20-22 (n=1,724), Apr. 22-24 (n= 1,651), and Mar. 23-25 (n=1,601); and in 2019 – Aug. 22-24 (n = 2,485).
Twitter