Cancel OK

GRAPHIC: Inside papayas’ growth

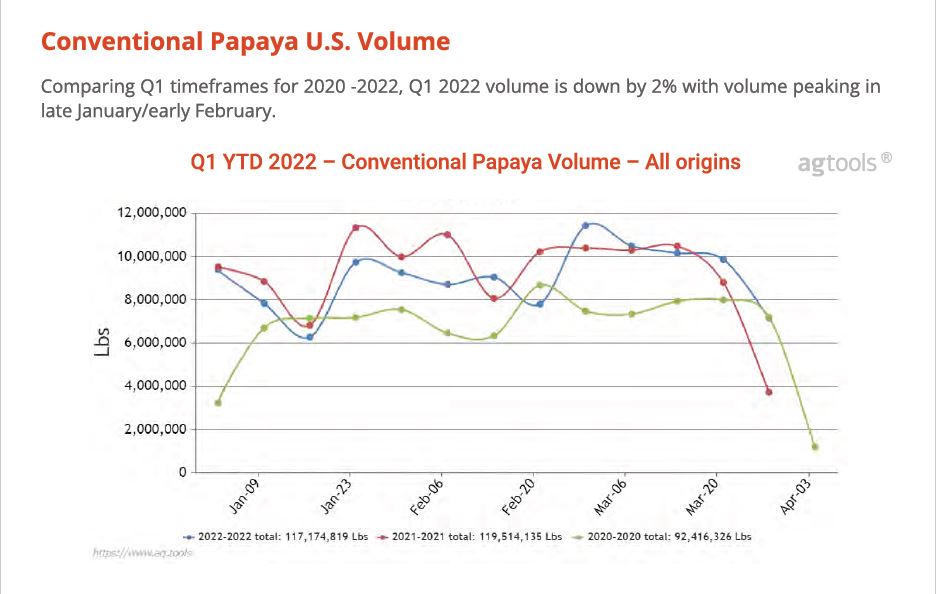
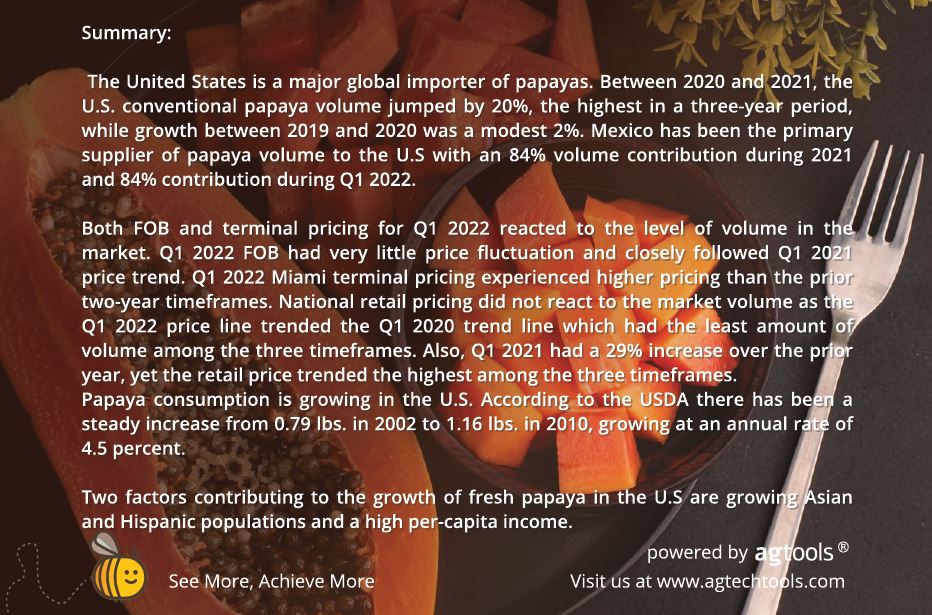
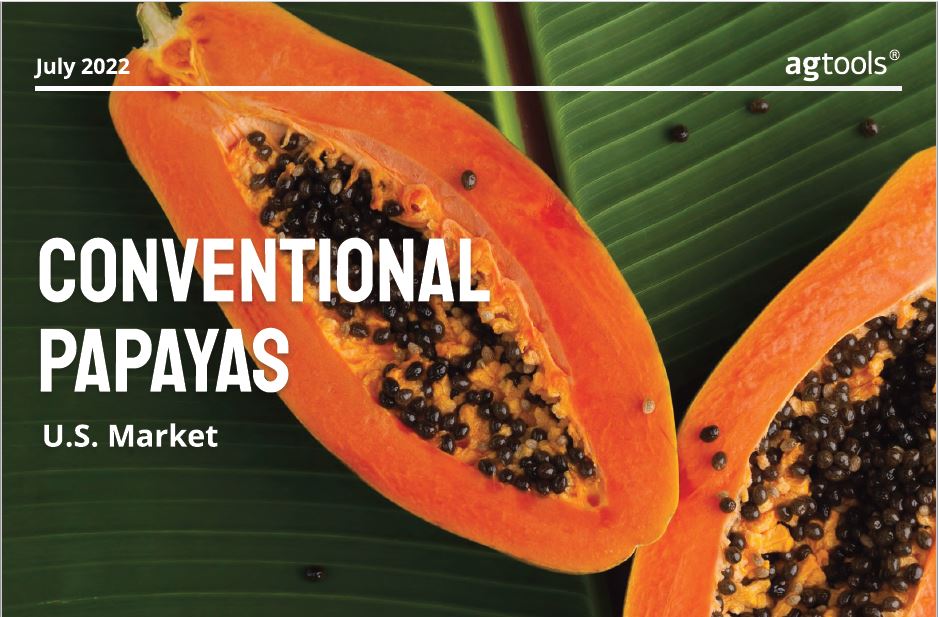
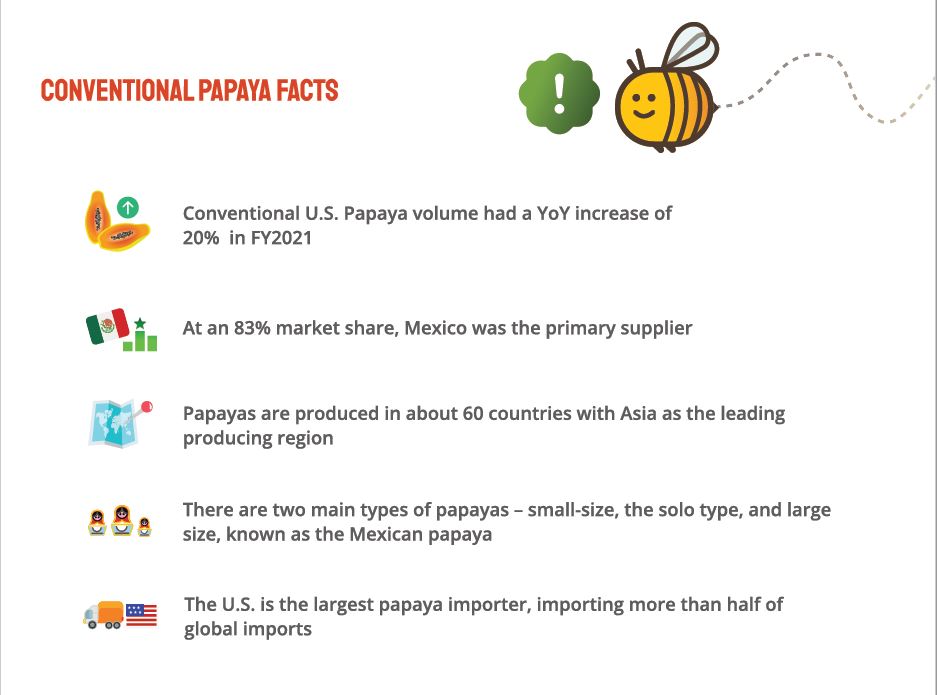
The volume of papayas shipped to the U.S. grew by 20 percent from 2020 to 2021, and it’s reflected in growing levels of consumption from American consumers.

Last year, 83 percent of papayas sold in the U.S. came from Mexico, while Guatemala comes in well behind in second place. A handful of other countries send papayas to the U.S. in lighter volumes.

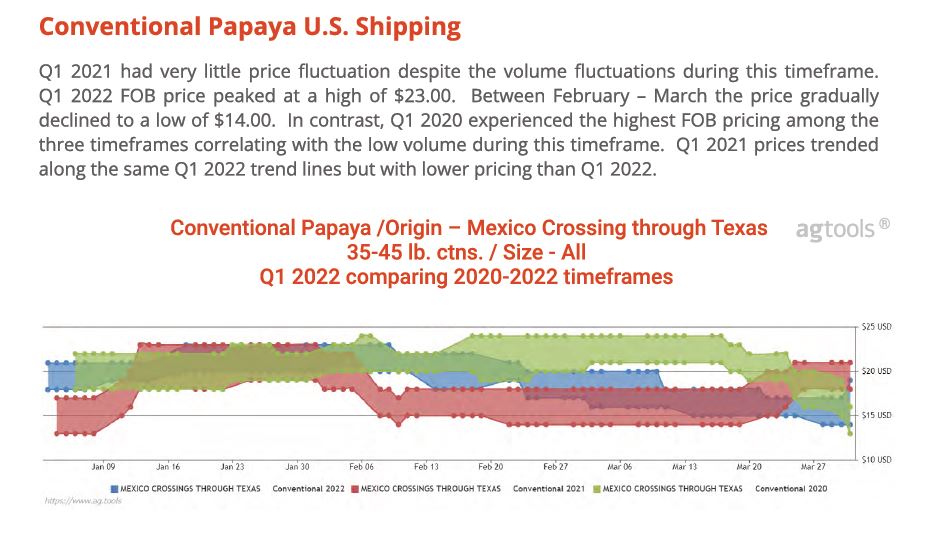
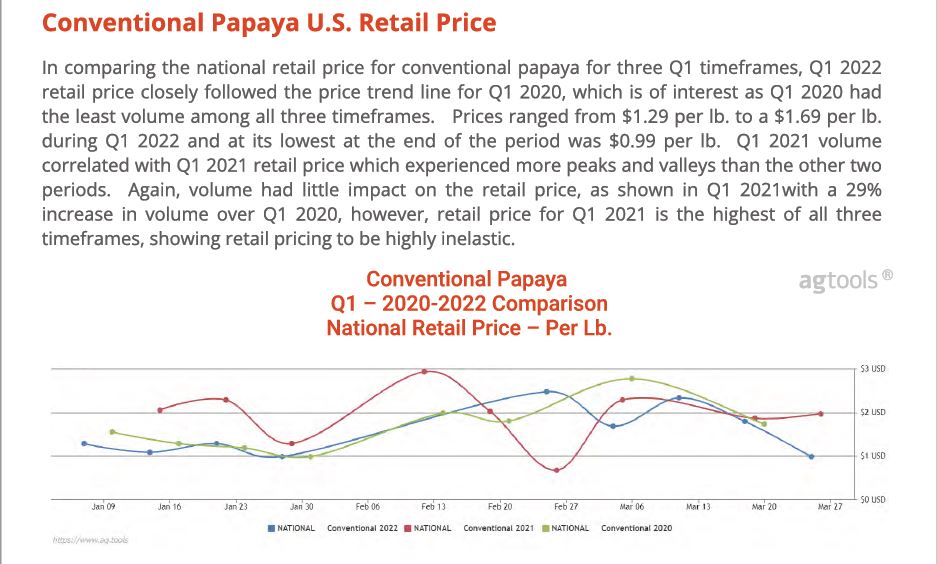
The following graphic was produced by Agtools Inc. BB #:355102, to explain and describe prices and volume in relation to rising consumer demand for papayas.
agtools papaya chart agtools papaya chart agtools papaya chart agtools papaya chart agtools papaya chart agtools papaya chart agtools papaya chart agtools papaya chart

Twitter

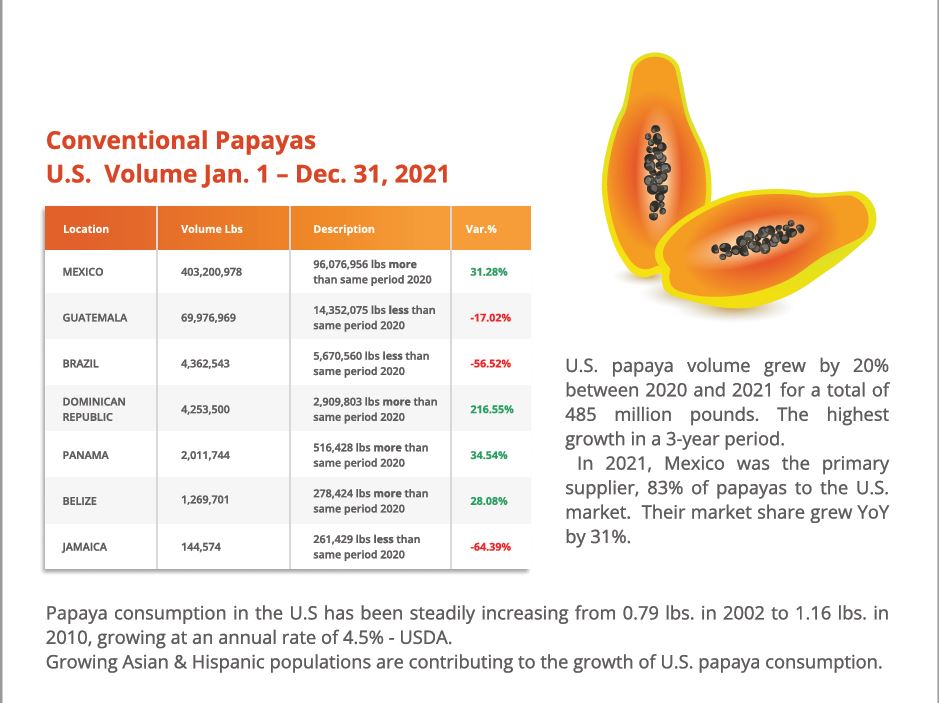
The volume of papayas shipped to the U.S. grew by 20 percent from 2020 to 2021, and it’s reflected in growing levels of consumption from American consumers.

Last year, 83 percent of papayas sold in the U.S. came from Mexico, while Guatemala comes in well behind in second place. A handful of other countries send papayas to the U.S. in lighter volumes.

The following graphic was produced by Agtools Inc. BB #:355102, to explain and describe prices and volume in relation to rising consumer demand for papayas.
agtools papaya chart agtools papaya chart agtools papaya chart agtools papaya chart agtools papaya chart agtools papaya chart agtools papaya chart agtools papaya chart

Twitter