After four weeks of descent, the ProduceIQ Index rebounded by +2 percent. Overall, produce prices tend to increase from the increased demand of the December holiday season and slightly due to the import of cherries.
Cherries, at $4.82 per pound, have an outsized impact on our sales-weighted index because of their high price per pound.
Though a slow start to Chile’s cherry export season, prices began attractively priced at $53 per 5 kg case. Cherry prices tend to fall to $30 over the next 8 weeks.
ProduceIQ Index: $1.03/pound, +1.98 percent over prior week
Week #48, ending November 26th
Blue Book has teamed with ProduceIQ BB #:368175 to bring the ProduceIQ Index to its readers. The index provides a produce industry price benchmark using 40 top commodities to provide data for decision making.
On the other hand, green beans are down -34 percent over the previous week. Although Florida’s green bean production is lighter than previous years, Mexican supply dramatically increased on this holiday staple.
Demand for beans is insufficient overcome the increased supply. Bean prices are near a ten-year low for this time of year, $13 per case, and may fall lower depending on Mexican crossings.
A relatively high percentage of a bean’s total growing cost is post-harvest; therefore, beans have a higher price floor. When low market prices don’t justify the high variable costs of pick, pack, and haul, bean fields are susceptible to being disked, without harvesting.
We’re encouraging the promotion of beans, even if that inspires farmer-friendly Christmas gifts. Let’s move some beans this December!

At the end of the week, green beans fell to $13, which is below production costs.

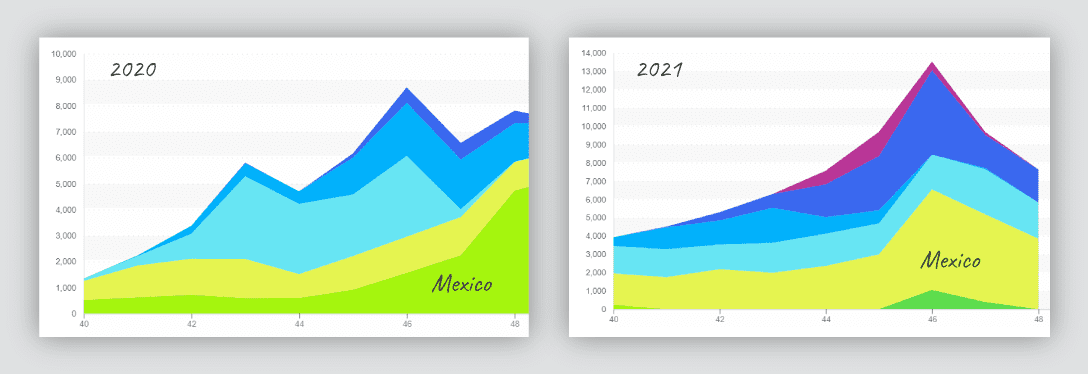
Volume increased from 9 million pounds at the peak week in 2020 to over 13 million pounds in 2021. The stacked area charts represent volume of green beans by week (stated in 000’s pounds).
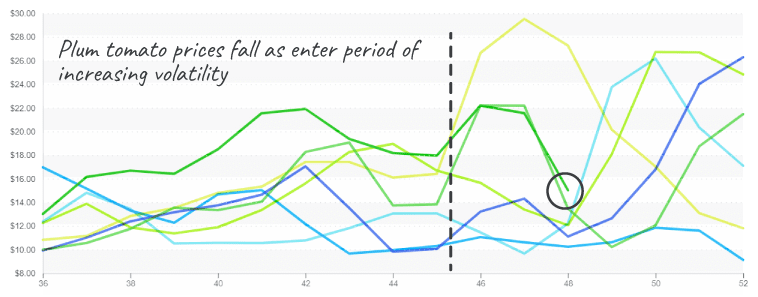
After an autumn marked by record-high prices, plum tomato prices are returning to Earth. Prices are down -30 percent over the previous week. Increased production out of Florida and Mexico is easing tight tomato supply. Tomato markets may remain active until production from Sinaloa picks up in January.

Plum (Roma) tomatoes is following the pattern of year 2020, which dropped to $10 before rebounding.
Broccoli prices are finally taking the plunge, down -22 percent over the previous week. Limited supply and poor quality out of Mexico and California are still an issue, but the beginning of Yuma’s season is providing some relief to over-exerted markets. Expect prices to increase as Yuma’s volume picks up steadily.
Please visit our online marketplace here and enjoy free access to our market tools which created the graphs above.
ProduceIQ Index
The ProduceIQ Index is the fresh produce industry’s only shipping point price index. It represents the industry-wide price per pound at the location of packing for domestic produce, and at the port of U.S. entry for imported produce.
ProduceIQ uses 40 top commodities to represent the industry. The Index weights each commodity dynamically, by season, as a function of the weekly 5-year rolling average Sales. Sales are calculated using the USDA’s Agricultural Marketing Service for movement and price data. The Index serves as a fair benchmark for industry price performance.
After four weeks of descent, the ProduceIQ Index rebounded by +2 percent. Overall, produce prices tend to increase from the increased demand of the December holiday season and slightly due to the import of cherries.
Cherries, at $4.82 per pound, have an outsized impact on our sales-weighted index because of their high price per pound.
Though a slow start to Chile’s cherry export season, prices began attractively priced at $53 per 5 kg case. Cherry prices tend to fall to $30 over the next 8 weeks.
ProduceIQ Index: $1.03/pound, +1.98 percent over prior week
Week #48, ending November 26th
Blue Book has teamed with ProduceIQ BB #:368175 to bring the ProduceIQ Index to its readers. The index provides a produce industry price benchmark using 40 top commodities to provide data for decision making.
On the other hand, green beans are down -34 percent over the previous week. Although Florida’s green bean production is lighter than previous years, Mexican supply dramatically increased on this holiday staple.
Demand for beans is insufficient overcome the increased supply. Bean prices are near a ten-year low for this time of year, $13 per case, and may fall lower depending on Mexican crossings.
A relatively high percentage of a bean’s total growing cost is post-harvest; therefore, beans have a higher price floor. When low market prices don’t justify the high variable costs of pick, pack, and haul, bean fields are susceptible to being disked, without harvesting.
We’re encouraging the promotion of beans, even if that inspires farmer-friendly Christmas gifts. Let’s move some beans this December!

At the end of the week, green beans fell to $13, which is below production costs.

Volume increased from 9 million pounds at the peak week in 2020 to over 13 million pounds in 2021. The stacked area charts represent volume of green beans by week (stated in 000’s pounds).
After an autumn marked by record-high prices, plum tomato prices are returning to Earth. Prices are down -30 percent over the previous week. Increased production out of Florida and Mexico is easing tight tomato supply. Tomato markets may remain active until production from Sinaloa picks up in January.

Plum (Roma) tomatoes is following the pattern of year 2020, which dropped to $10 before rebounding.
Broccoli prices are finally taking the plunge, down -22 percent over the previous week. Limited supply and poor quality out of Mexico and California are still an issue, but the beginning of Yuma’s season is providing some relief to over-exerted markets. Expect prices to increase as Yuma’s volume picks up steadily.
Please visit our online marketplace here and enjoy free access to our market tools which created the graphs above.
ProduceIQ Index
The ProduceIQ Index is the fresh produce industry’s only shipping point price index. It represents the industry-wide price per pound at the location of packing for domestic produce, and at the port of U.S. entry for imported produce.
ProduceIQ uses 40 top commodities to represent the industry. The Index weights each commodity dynamically, by season, as a function of the weekly 5-year rolling average Sales. Sales are calculated using the USDA’s Agricultural Marketing Service for movement and price data. The Index serves as a fair benchmark for industry price performance.
Mark Campbell was introduced to the fresh produce industry as a lender for Farm Credit. After earning his MBA from Columbia Business School, he spent seven years as CFO for J&J Family of Farms and later served as CFO advisor to several produce growers, shippers and distributors. In this role, Mark saw the impediments that prevent produce growers and buyers to trade with greater access and efficiency. This led him to cofound ProduceIQ.


