Somewhere in middle-of-nowhere Iowa, a field of corn has once again transformed into a field of dreams. And ProduceIQ, as adamant Kevin Costner fans and children of the eighties, could not miss the opportunity to talk about one of our more nostalgic commodities, sweet corn.
Now before you go and get your britches in a twist, we are quite aware that the corn surrounding Costner’s iconic baseball diamond is field corn, and not our beloved industry’s sweet corn.
In fact, only one percent of the corn grown in Iowa is sweet corn. We just couldn’t pass up an opportunity to mention one of the most viewed Major League Baseball events in the past 15 years.
The last time we featured corn in late March, prices had risen again and were breaking records. Oh how times have changed. Sweet corn started the year at a record $35 per case and didn’t settle until early April.
Since then, prices have continued to fall to under $10 per case. According to USDA data, by the dog days of August, consumers have pretty much gotten their fill of sweet corn and volume doesn’t spike again till next Spring leading to the Memorial Day pull.

Corn prices are low, though enter a period of increased volatility in 2 weeks.

Corn consumption drops dramatically during July (2019 data is representative of normal). USDA data in late summer may be skewed by an increased level of local growers that don’t report movement.
Blue Book has teamed with ProduceIQ BB #:368175 to bring the ProduceIQ Index to its readers. The index provides a produce industry price benchmark using 40 top commodities to provide data for decision making.
ProduceIQ Index: $0.96 /pound, -3.0 percent over prior week
Week #32, ending August 13th
Aggravated by struggling supplies in the East and West, Squash is about to have the highest price for this week during the past ten years. Rainy conditions in the East are reducing yields, and in the West, unfavorable growing conditions are also decreasing squash grower’s output. Freight costs are an ongoing obstacle to moving produce from the West to the East.

Squash prices remain volatile until the fall harvest in Georgia.
Another member of the ProduceIQ Dry Veg category, bell peppers are down -15 percent over the previous week and a bargain under $9 per carton. Aided by plentiful summer growing regions, pepper supply is at the lowest week #32 prices in eight years.
Surprise… a California leafy green is super high, rising from less than $10 to over $17 in four weeks. Due to sweltering Western heat, spinach prices are poised to go higher. Spinach supply tends to stay fairly sparse until cooler weather brings the Southwest and Mexican growing regions online in the fall.
However, this year’s increases are further intensified by abnormally high summer temps in the Salinas/Watsonville growing region.
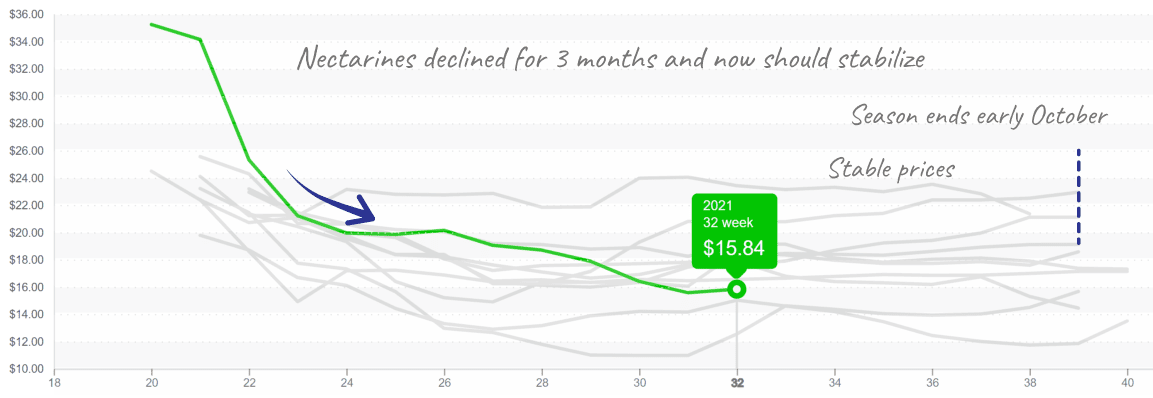
Nectarines are at an eight-year low. In a classic supply-exceeds-demand scenario, nectarines are down to $17 per 2-layer tray pack. Certainly promotable, prices should continue to stay low until domestic season peters out around week #40.

Nectarine prices tend to flatten for the next 6 weeks till the season winds down.
Please visit our online marketplace here, and enjoy free access to our market tools which created the graphs above.
ProduceIQ Index
The ProduceIQ Index is the fresh produce industry’s only shipping point price index. It represents the industry-wide price per pound at the location of packing for domestic produce, and at the port of U.S. entry for imported produce.
ProduceIQ uses 40 top commodities to represent the industry. The Index weights each commodity dynamically, by season, as a function of the weekly 5-year rolling average Sales. Sales are calculated using the USDA’s Agricultural Marketing Service for movement and price data. The Index serves as a fair benchmark for industry price performance.
Somewhere in middle-of-nowhere Iowa, a field of corn has once again transformed into a field of dreams. And ProduceIQ, as adamant Kevin Costner fans and children of the eighties, could not miss the opportunity to talk about one of our more nostalgic commodities, sweet corn.
Now before you go and get your britches in a twist, we are quite aware that the corn surrounding Costner’s iconic baseball diamond is field corn, and not our beloved industry’s sweet corn.
In fact, only one percent of the corn grown in Iowa is sweet corn. We just couldn’t pass up an opportunity to mention one of the most viewed Major League Baseball events in the past 15 years.
The last time we featured corn in late March, prices had risen again and were breaking records. Oh how times have changed. Sweet corn started the year at a record $35 per case and didn’t settle until early April.
Since then, prices have continued to fall to under $10 per case. According to USDA data, by the dog days of August, consumers have pretty much gotten their fill of sweet corn and volume doesn’t spike again till next Spring leading to the Memorial Day pull.

Corn prices are low, though enter a period of increased volatility in 2 weeks.

Corn consumption drops dramatically during July (2019 data is representative of normal). USDA data in late summer may be skewed by an increased level of local growers that don’t report movement.
Blue Book has teamed with ProduceIQ BB #:368175 to bring the ProduceIQ Index to its readers. The index provides a produce industry price benchmark using 40 top commodities to provide data for decision making.
ProduceIQ Index: $0.96 /pound, -3.0 percent over prior week
Week #32, ending August 13th
Aggravated by struggling supplies in the East and West, Squash is about to have the highest price for this week during the past ten years. Rainy conditions in the East are reducing yields, and in the West, unfavorable growing conditions are also decreasing squash grower’s output. Freight costs are an ongoing obstacle to moving produce from the West to the East.

Squash prices remain volatile until the fall harvest in Georgia.
Another member of the ProduceIQ Dry Veg category, bell peppers are down -15 percent over the previous week and a bargain under $9 per carton. Aided by plentiful summer growing regions, pepper supply is at the lowest week #32 prices in eight years.
Surprise… a California leafy green is super high, rising from less than $10 to over $17 in four weeks. Due to sweltering Western heat, spinach prices are poised to go higher. Spinach supply tends to stay fairly sparse until cooler weather brings the Southwest and Mexican growing regions online in the fall.
However, this year’s increases are further intensified by abnormally high summer temps in the Salinas/Watsonville growing region.
Nectarines are at an eight-year low. In a classic supply-exceeds-demand scenario, nectarines are down to $17 per 2-layer tray pack. Certainly promotable, prices should continue to stay low until domestic season peters out around week #40.

Nectarine prices tend to flatten for the next 6 weeks till the season winds down.
Please visit our online marketplace here, and enjoy free access to our market tools which created the graphs above.
ProduceIQ Index
The ProduceIQ Index is the fresh produce industry’s only shipping point price index. It represents the industry-wide price per pound at the location of packing for domestic produce, and at the port of U.S. entry for imported produce.
ProduceIQ uses 40 top commodities to represent the industry. The Index weights each commodity dynamically, by season, as a function of the weekly 5-year rolling average Sales. Sales are calculated using the USDA’s Agricultural Marketing Service for movement and price data. The Index serves as a fair benchmark for industry price performance.
Mark Campbell was introduced to the fresh produce industry as a lender for Farm Credit. After earning his MBA from Columbia Business School, he spent seven years as CFO for J&J Family of Farms and later served as CFO advisor to several produce growers, shippers and distributors. In this role, Mark saw the impediments that prevent produce growers and buyers to trade with greater access and efficiency. This led him to cofound ProduceIQ.


