Shoppers are increasingly choosing to grocery shop inside the store as COVID-19 concerns abate.
“While online grocery shopping certainly remains elevated from the pre-pandemic levels, we saw an increase in in-store shopping along with more time spent shopping in April,” said Jonna Parker, Team Lead, Fresh for IRI. Referring to the April wave of the consumer survey with primary grocery shoppers Parker added, “Reflecting on their last grocery trip, 85% of consumers shopped in-store, up a few points versus the last three months. Additionally, 68% now say they will do all of their grocery shopping in-store, up four points versus last month.”
The better COVID-19 outlook appears to be directly related to the return to in-store shopping.
“Concern about COVID-19 dropped month over month and 66% of shoppers felt relaxed during their last in-store trip, up 13 points since January. Importantly, consumers who have been vaccinated are more likely to do all shopping in-store and are the ones driving the more relaxed in-store mindset. This points to potentially ongoing shifts back to pre-pandemic behaviors as more people get vaccinated,” said Parker.
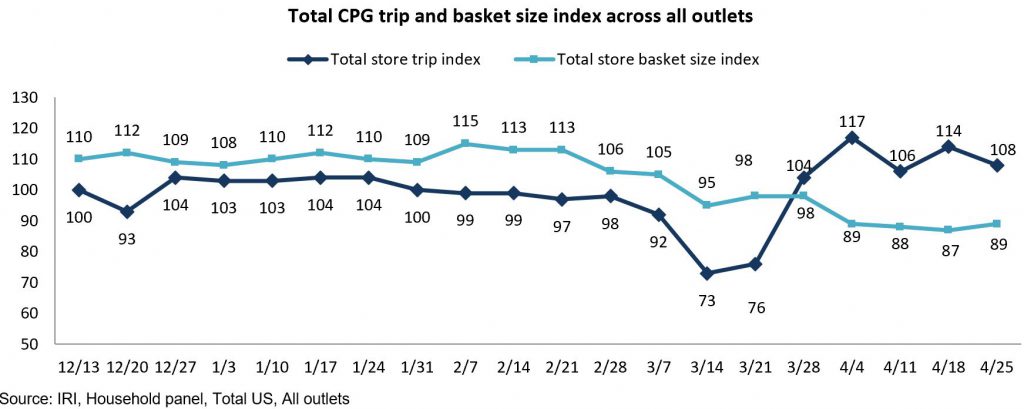
April 2020 experienced continued highly elevated sales as most states had issued shelter-in-place mandates — moving the vast majority of meal occasions to at-home. During this time, trips fell far below year-ago levels whereas the average basket ring came in well ahead of the pre-pandemic normal. While fresh produce sales did well, the lack of trips and greater food need drove above-average share for both canned and frozen fruit and vegetables as people were focused on shelf life. In April 2021, sales had to go up against these record numbers and the results were mixed. As demand continues to be elevated, some categories squeezed out gains over 2020 whereas others fell short of matching the 2020 records.
210 Analytics, IRI and the Produce Marketing Association (PMA) partnered to understand how fresh produce performed relative to their 2020 and 2019 performances.
Trips and Basket Size
As shelter-in-place mandates ensued in April 2020, in-store visits fell far below normal while people bought significantly more when making a trip. That means one year later, trips sit well above year ago, though much in line with typical years, while the average basket size dropped well below that of April 2020.
 “Retail success in future months lies in the continued capturing of trips along with optimizing the spend in a vastly different environment than one year ago,” said Joe Watson, VP of Membership and Engagement for the Produce Marketing Association (PMA). “Shoppers are re-engaging with in-store shopping, which is a positive development for fresh produce, particularly on the fruit side. At the same time, restaurant sales are rapidly gearing up and for fresh produce as a whole this will likely mean a more balanced supply chain.”
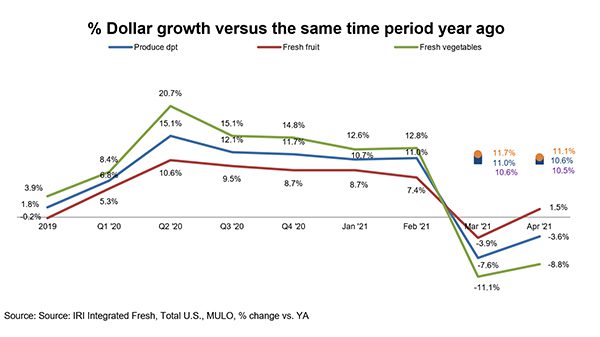
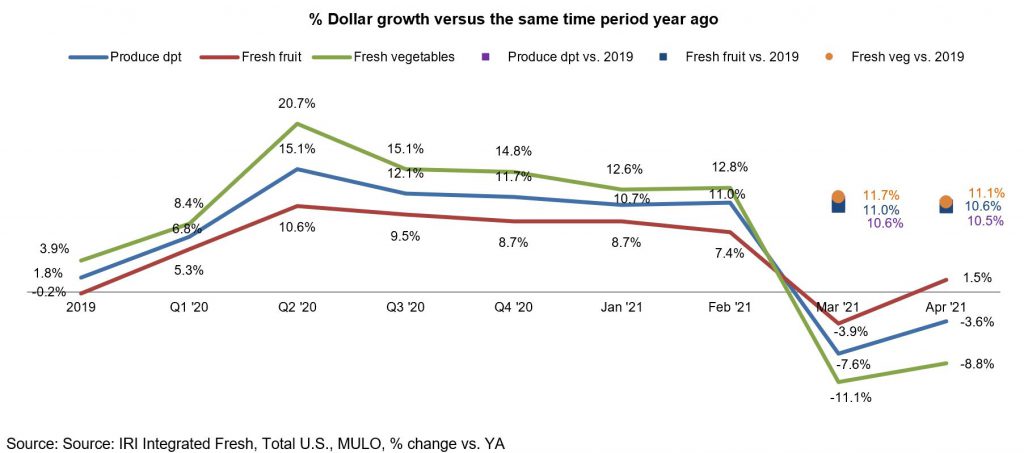
April produce department sales for the four weeks ending 4/25/2021 decreased 3.6% year on year. However, in comparison to the 2019 pre-pandemic normal, fresh produce sales at retail were up 10.3%. This means that demand is holding around the same level seen in the third and fourth quarters of 2020. Because of the shift to both canned and frozen during the early weeks of the pandemic last year, declines in these areas are much bigger, at -19.0% for frozen fruits and vegetables and -32.5% for canned vegetables.

“We know the year-over-year picture will likely be off for a few months, but it is very encouraging to see that demand is holding strong versus the pre-pandemic normal,” said Watson. “All indicators point to consumers moving around more and that could mean fewer meals consumed at home. Keeping an eye on the demand versus 2019 will help us understand the at-home versus out-of-home balance, which is imperative for demand forecasting.”
Fresh produce generated $5.4 billion in sales during the four April 2021 weeks, up slightly from $5.3 billion in March, 2021. While this is down $206 million from April 2020, it is up $523 million from the 2019 pre-pandemic normal. Importantly, fruit managed a gain over both 2019 and 2020 levels. Vegetables, that had a very strong April 2020, did fall short over year-ago levels, but increased 11.1% versus the pre-pandemic normal. Demand versus 2019 is virtually unchanged from March for both fruit and vegetables.
Fresh Share
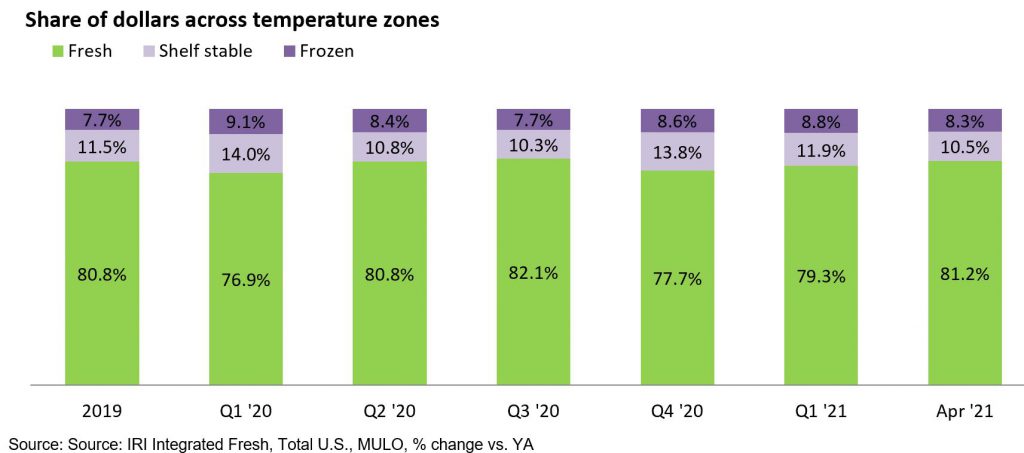
In 2019, fresh produce sales represented 80.8% of total fruits and vegetables sales across the store. That share fell as low as 76.9% during the first quarter of 2020, pulled down by the March panic buying weeks when many dollars were diverted to frozen and canned. While frozen fruit and vegetables remain elevated, the fresh share reached its highest point since the third quarter of 2020, at 81.2% of dollars.
“We are keeping a close eye on the fresh share each month,” said Watson. “It is encouraging to see a rising share and I suspect that the impulse nature of the summer fruit season will further boost the fresh allocation to total fruit and vegetable dollars.”
Fresh Produce Dollars versus Volume
Early on in the pandemic, fresh produce experienced deflation with volume outpacing dollar growth, though both experienced record highs. In going up against those patterns in April 2021, both dollars and volume sales were down year-on-year, however, dollars decreased only 3.6% versus 10.8% for volume. Further widening that gap is the inflation in April 2021 versus deflation in April 2020. When compared to the 2019 pre-pandemic baseline, both volume and dollar sales were up significantly. Dollars in April 2021 were up 10.6% versus the pre-pandemic normal and volume was up 18.6% versus 2019.
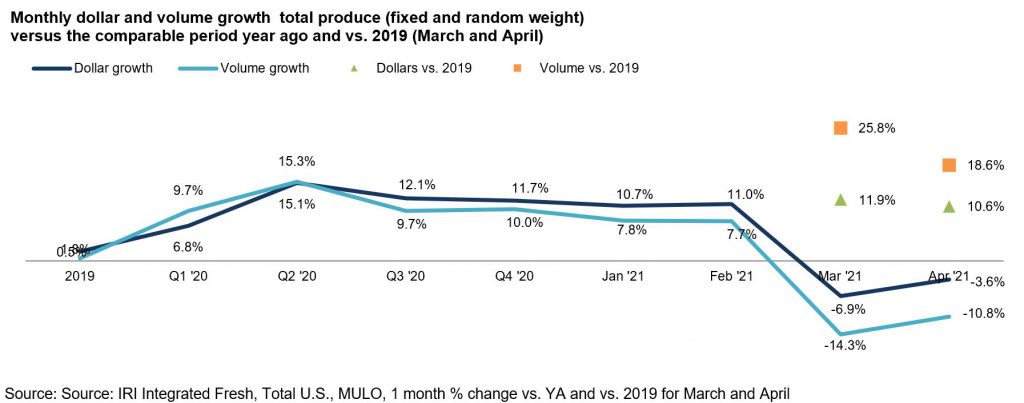
“Rolling up the January through March 2021 results shows a strong start of the year,” said Watson. “While year-on-year comparisons for April makes it looks like consumption has dropped drastically, reality is that demand for fruit and vegetables remains robust. The easiest way to look at performance is to compare April 2021 dollars and pounds to those sold in April 2019 — showing double-digit increases for both dollars and pounds.”
Watson adds, “Switching to the year-on-year view shows better results for fruit because the spikes in fruit were not as high as those of vegetables in the early pandemic weeks. Additionally, we switched from a deflationary environment to an inflationary world.”

As Watson explained, prices for both fresh fruit and vegetables were up around 8% over April 2020 levels.

Fresh Fruit
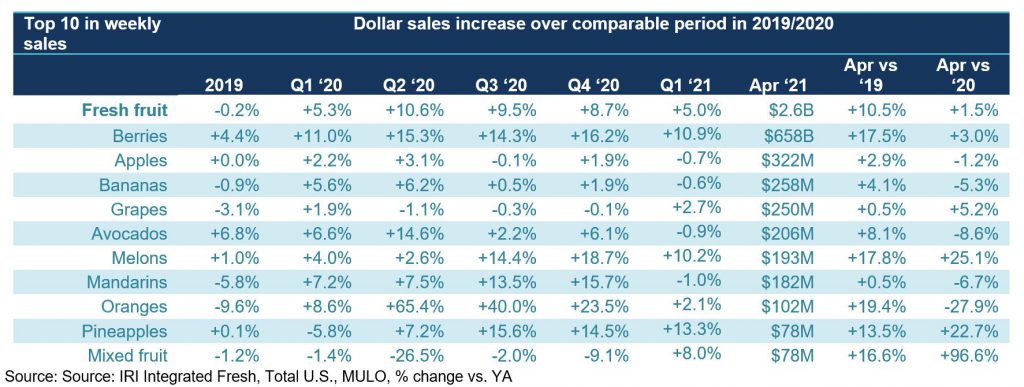
“In fruit, we are seeing some interesting changes as people are moving around more,” said Parker. “While berries remain the untouchable number one, the sales of melons and mixed fruit show that value-added is making a comeback. We have not seen mixed fruit in the top 10 sellers all year, but with a year-over-year gain of 96.6% and a robust 16.6% increase versus the 2019 pre-pandemic normal, people are definitely re-engaging.”
Only five out of the top 10 selling fruits lost ground versus the tremendous sales spikes of 2020, being apples, bananas, avocados, mandarins and oranges. Berries are a notable exception: in addition to being the biggest seller still managed robust sales increases both in the comparison to the 2019 pre-pandemic normal (+10.5%) and the year-on-year view (+1.5%). While oranges were not able to hold on to the very strong April 2020 results, they are certainly still doing very well against normal levels, up 19.4%.
Fresh Vegetables
“Vegetables’ enormous strength in 2020 means a much tougher road now,” said Watson. “Yet, we see packaged salads’ dollar sales still ahead of those 2020 peaks, at +20.7% along with cucumbers that also managed a gain, at +2.1%.” In comparison with the 2019 pre-pandemic base line, all vegetables were up in April, with the highest gain of 26.0% for packaged salads.

Absolute Dollar Gains
“Despite going up against huge April 2020, salad kits still managed to sell an additional $44 million year-on-year,” said Watson. “The strength of berries is also clear with an additional $19 million sold. The comeback of entertaining and the greater reliance on convenience also clearly emerges from the Top 10 in absolute dollar growth, with appearances by mixed fruit and party trays. Easter likely affected the strength in pineapple and asparagus sales.”

Fresh versus Frozen and Shelf-Stable Fruits and Vegetables
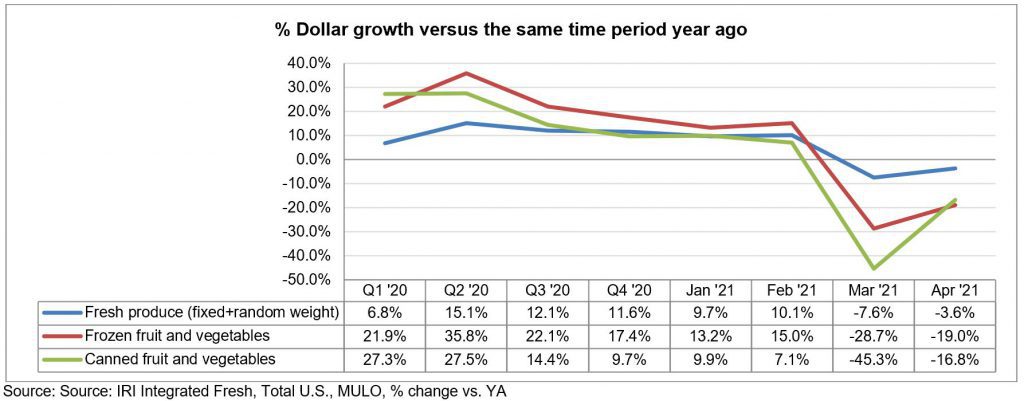
While fresh fruit and vegetables dollar sales at retail only decreased 3.6% in April 2021, both frozen and shelf-stable saw much greater declines due to going up against very high double-digit increases in April 2020.
Perimeter Performance
A look across departments for the four weeks ending April 25, 2021 versus year ago shows a mixed performance. Seafood sales remain incredibly strong, up 26.5% against 2019 and 11.5% versus year ago. Bakery and deli also moved into positive territory as they are now going up against the time when many deli and bakery service counters and self-serve displays were closed during the early weeks of the pandemic.

Floral
The floral department’s pandemic path was very different from most departments. In March and April, in efforts to keep the shelves stocked, many retailers pulled back on floral orders. Yet, come the third quarter, floral proved it was a pandemic powerhouse in its own right. In fact, floral started outpacing produce growth come summer and has remained highly elevated ever since. In April 2021, dollar sales were +75.5% over year ago, when few retailers stocked floral. Importantly, floral sales also hold their own against the pre-pandemic 2019 baseline, with an increase of 26.3%.

What’s Next?
 Several indicators of consumer mobility — reflecting how much people are moving around to go to school, work, out to dinner, vacation or visit family and friends, etc.— continue to trend up. In April, TSA checkpoint numbers, dining out, driving and walking statistics, gasoline sales, the re-opening of schools and more are all indicating a higher level of consumer mobility.
“In-person schooling continues to rise, with about 60% of the nation’s school-aged kids going to school at least part of the week,” said Parker, referencing IRI consumer research with primary grocery shoppers. Up from 31% in March, 44% of kids ages six to 12 are going to their school full time. Another 15% are in a hybrid model. Up from 24%, 33% of teens are going to school full time, and another 26% are in a hybrid model.” Increased mobility is also likely to result in a shift from home-centric food spending to greater foodservice engagement, but may also drive increased demand for time-saving, convenience focused solutions. It will also likely impact the breakfast and lunch occasions.
The next report, covering May, will be released in mid-June. We encourage you to contact Joe Watson, PMA’s Vice President of Membership and Engagement, at jwatson@pma.com with any questions or concerns. Please recognize the continued dedication of the entire grocery and produce supply chains, from farm to retailer. #produce #joyoffresh #SupermarketSuperHeroes.
Date ranges:
2019: 52 weeks ending 12/28/2019
Q1 2020: 13 weeks ending 3/29/2020
Q2 2020: 13 weeks ending 6/28/2020
Q3 2020: 13 weeks ending 9/27/2020
Q4 2020: 13 weeks ending 12/27/2020
Q1 2021: 13 weeks ending 3/28/2021
April: 4 weeks ending 4/25/2021
Shoppers are increasingly choosing to grocery shop inside the store as COVID-19 concerns abate.
“While online grocery shopping certainly remains elevated from the pre-pandemic levels, we saw an increase in in-store shopping along with more time spent shopping in April,” said Jonna Parker, Team Lead, Fresh for IRI. Referring to the April wave of the consumer survey with primary grocery shoppers Parker added, “Reflecting on their last grocery trip, 85% of consumers shopped in-store, up a few points versus the last three months. Additionally, 68% now say they will do all of their grocery shopping in-store, up four points versus last month.”
The better COVID-19 outlook appears to be directly related to the return to in-store shopping.
“Concern about COVID-19 dropped month over month and 66% of shoppers felt relaxed during their last in-store trip, up 13 points since January. Importantly, consumers who have been vaccinated are more likely to do all shopping in-store and are the ones driving the more relaxed in-store mindset. This points to potentially ongoing shifts back to pre-pandemic behaviors as more people get vaccinated,” said Parker.
April 2020 experienced continued highly elevated sales as most states had issued shelter-in-place mandates — moving the vast majority of meal occasions to at-home. During this time, trips fell far below year-ago levels whereas the average basket ring came in well ahead of the pre-pandemic normal. While fresh produce sales did well, the lack of trips and greater food need drove above-average share for both canned and frozen fruit and vegetables as people were focused on shelf life. In April 2021, sales had to go up against these record numbers and the results were mixed. As demand continues to be elevated, some categories squeezed out gains over 2020 whereas others fell short of matching the 2020 records.
210 Analytics, IRI and the Produce Marketing Association (PMA) partnered to understand how fresh produce performed relative to their 2020 and 2019 performances.
Trips and Basket Size
As shelter-in-place mandates ensued in April 2020, in-store visits fell far below normal while people bought significantly more when making a trip. That means one year later, trips sit well above year ago, though much in line with typical years, while the average basket size dropped well below that of April 2020.
 “Retail success in future months lies in the continued capturing of trips along with optimizing the spend in a vastly different environment than one year ago,” said Joe Watson, VP of Membership and Engagement for the Produce Marketing Association (PMA). “Shoppers are re-engaging with in-store shopping, which is a positive development for fresh produce, particularly on the fruit side. At the same time, restaurant sales are rapidly gearing up and for fresh produce as a whole this will likely mean a more balanced supply chain.”
April produce department sales for the four weeks ending 4/25/2021 decreased 3.6% year on year. However, in comparison to the 2019 pre-pandemic normal, fresh produce sales at retail were up 10.3%. This means that demand is holding around the same level seen in the third and fourth quarters of 2020. Because of the shift to both canned and frozen during the early weeks of the pandemic last year, declines in these areas are much bigger, at -19.0% for frozen fruits and vegetables and -32.5% for canned vegetables.

“We know the year-over-year picture will likely be off for a few months, but it is very encouraging to see that demand is holding strong versus the pre-pandemic normal,” said Watson. “All indicators point to consumers moving around more and that could mean fewer meals consumed at home. Keeping an eye on the demand versus 2019 will help us understand the at-home versus out-of-home balance, which is imperative for demand forecasting.”
Fresh produce generated $5.4 billion in sales during the four April 2021 weeks, up slightly from $5.3 billion in March, 2021. While this is down $206 million from April 2020, it is up $523 million from the 2019 pre-pandemic normal. Importantly, fruit managed a gain over both 2019 and 2020 levels. Vegetables, that had a very strong April 2020, did fall short over year-ago levels, but increased 11.1% versus the pre-pandemic normal. Demand versus 2019 is virtually unchanged from March for both fruit and vegetables.

Fresh Share
In 2019, fresh produce sales represented 80.8% of total fruits and vegetables sales across the store. That share fell as low as 76.9% during the first quarter of 2020, pulled down by the March panic buying weeks when many dollars were diverted to frozen and canned. While frozen fruit and vegetables remain elevated, the fresh share reached its highest point since the third quarter of 2020, at 81.2% of dollars.
“We are keeping a close eye on the fresh share each month,” said Watson. “It is encouraging to see a rising share and I suspect that the impulse nature of the summer fruit season will further boost the fresh allocation to total fruit and vegetable dollars.”

Fresh Produce Dollars versus Volume
Early on in the pandemic, fresh produce experienced deflation with volume outpacing dollar growth, though both experienced record highs. In going up against those patterns in April 2021, both dollars and volume sales were down year-on-year, however, dollars decreased only 3.6% versus 10.8% for volume. Further widening that gap is the inflation in April 2021 versus deflation in April 2020. When compared to the 2019 pre-pandemic baseline, both volume and dollar sales were up significantly. Dollars in April 2021 were up 10.6% versus the pre-pandemic normal and volume was up 18.6% versus 2019.

“Rolling up the January through March 2021 results shows a strong start of the year,” said Watson. “While year-on-year comparisons for April makes it looks like consumption has dropped drastically, reality is that demand for fruit and vegetables remains robust. The easiest way to look at performance is to compare April 2021 dollars and pounds to those sold in April 2019 — showing double-digit increases for both dollars and pounds.”
Watson adds, “Switching to the year-on-year view shows better results for fruit because the spikes in fruit were not as high as those of vegetables in the early pandemic weeks. Additionally, we switched from a deflationary environment to an inflationary world.”

As Watson explained, prices for both fresh fruit and vegetables were up around 8% over April 2020 levels.

Fresh Fruit
“In fruit, we are seeing some interesting changes as people are moving around more,” said Parker. “While berries remain the untouchable number one, the sales of melons and mixed fruit show that value-added is making a comeback. We have not seen mixed fruit in the top 10 sellers all year, but with a year-over-year gain of 96.6% and a robust 16.6% increase versus the 2019 pre-pandemic normal, people are definitely re-engaging.”
Only five out of the top 10 selling fruits lost ground versus the tremendous sales spikes of 2020, being apples, bananas, avocados, mandarins and oranges. Berries are a notable exception: in addition to being the biggest seller still managed robust sales increases both in the comparison to the 2019 pre-pandemic normal (+10.5%) and the year-on-year view (+1.5%). While oranges were not able to hold on to the very strong April 2020 results, they are certainly still doing very well against normal levels, up 19.4%.

Fresh Vegetables
“Vegetables’ enormous strength in 2020 means a much tougher road now,” said Watson. “Yet, we see packaged salads’ dollar sales still ahead of those 2020 peaks, at +20.7% along with cucumbers that also managed a gain, at +2.1%.” In comparison with the 2019 pre-pandemic base line, all vegetables were up in April, with the highest gain of 26.0% for packaged salads.

Absolute Dollar Gains
“Despite going up against huge April 2020, salad kits still managed to sell an additional $44 million year-on-year,” said Watson. “The strength of berries is also clear with an additional $19 million sold. The comeback of entertaining and the greater reliance on convenience also clearly emerges from the Top 10 in absolute dollar growth, with appearances by mixed fruit and party trays. Easter likely affected the strength in pineapple and asparagus sales.”

Fresh versus Frozen and Shelf-Stable Fruits and Vegetables
While fresh fruit and vegetables dollar sales at retail only decreased 3.6% in April 2021, both frozen and shelf-stable saw much greater declines due to going up against very high double-digit increases in April 2020.

Perimeter Performance
A look across departments for the four weeks ending April 25, 2021 versus year ago shows a mixed performance. Seafood sales remain incredibly strong, up 26.5% against 2019 and 11.5% versus year ago. Bakery and deli also moved into positive territory as they are now going up against the time when many deli and bakery service counters and self-serve displays were closed during the early weeks of the pandemic.

Floral
The floral department’s pandemic path was very different from most departments. In March and April, in efforts to keep the shelves stocked, many retailers pulled back on floral orders. Yet, come the third quarter, floral proved it was a pandemic powerhouse in its own right. In fact, floral started outpacing produce growth come summer and has remained highly elevated ever since. In April 2021, dollar sales were +75.5% over year ago, when few retailers stocked floral. Importantly, floral sales also hold their own against the pre-pandemic 2019 baseline, with an increase of 26.3%.

What’s Next?
 Several indicators of consumer mobility — reflecting how much people are moving around to go to school, work, out to dinner, vacation or visit family and friends, etc.— continue to trend up. In April, TSA checkpoint numbers, dining out, driving and walking statistics, gasoline sales, the re-opening of schools and more are all indicating a higher level of consumer mobility.
“In-person schooling continues to rise, with about 60% of the nation’s school-aged kids going to school at least part of the week,” said Parker, referencing IRI consumer research with primary grocery shoppers. Up from 31% in March, 44% of kids ages six to 12 are going to their school full time. Another 15% are in a hybrid model. Up from 24%, 33% of teens are going to school full time, and another 26% are in a hybrid model.” Increased mobility is also likely to result in a shift from home-centric food spending to greater foodservice engagement, but may also drive increased demand for time-saving, convenience focused solutions. It will also likely impact the breakfast and lunch occasions.
The next report, covering May, will be released in mid-June. We encourage you to contact Joe Watson, PMA’s Vice President of Membership and Engagement, at jwatson@pma.com with any questions or concerns. Please recognize the continued dedication of the entire grocery and produce supply chains, from farm to retailer. #produce #joyoffresh #SupermarketSuperHeroes.
Date ranges:
2019: 52 weeks ending 12/28/2019
Q1 2020: 13 weeks ending 3/29/2020
Q2 2020: 13 weeks ending 6/28/2020
Q3 2020: 13 weeks ending 9/27/2020
Q4 2020: 13 weeks ending 12/27/2020
Q1 2021: 13 weeks ending 3/28/2021
April: 4 weeks ending 4/25/2021
Anne-Marie Roerink is the president of 210 Analytics.
 “Retail success in future months lies in the continued capturing of trips along with optimizing the spend in a vastly different environment than one year ago,” said Joe Watson, VP of Membership and Engagement for the Produce Marketing Association (PMA). “Shoppers are re-engaging with in-store shopping, which is a positive development for fresh produce, particularly on the fruit side. At the same time, restaurant sales are rapidly gearing up and for fresh produce as a whole this will likely mean a more balanced supply chain.”
 Several indicators of consumer mobility — reflecting how much people are moving around to go to school, work, out to dinner, vacation or visit family and friends, etc.— continue to trend up. In April, TSA checkpoint numbers, dining out, driving and walking statistics, gasoline sales, the re-opening of schools and more are all indicating a higher level of consumer mobility.


