Prices for the overall ProduceIQ Index were deceptively buoyed by grapes and berries.
While most categories suffered, grapes and berries increased 8.1 percent, continuing to outperform other commodities before Valentine’s Day.
The spot market, for the remainder of the industry, fell dormant as the Northeastern U.S. was slammed with a major winter storm. The storm was so severe it led to the partial closing of Hunts Point, the Bronx wholesale produce market famous for remaining open 365 days a year.
Snow fall varied by location, spanning from only a few inches to a recorded 32 inches in New Jersey. Unfortunately for foodservice, Nor’easters and outdoor dining are proving to be incompatible.
ProduceIQ Index: $0.99 /pound, +4.2 percent over prior week
(Week #5, ending February 5th)
Blue Book has teamed with ProduceIQ BB #:368175 to bring the ProduceIQ Index to its readers. The index provides a produce industry price benchmark using 40 top commodities to provide data for decision making.
When hot soup is preferred over cold salad, it’s time to sell more butternut squash.
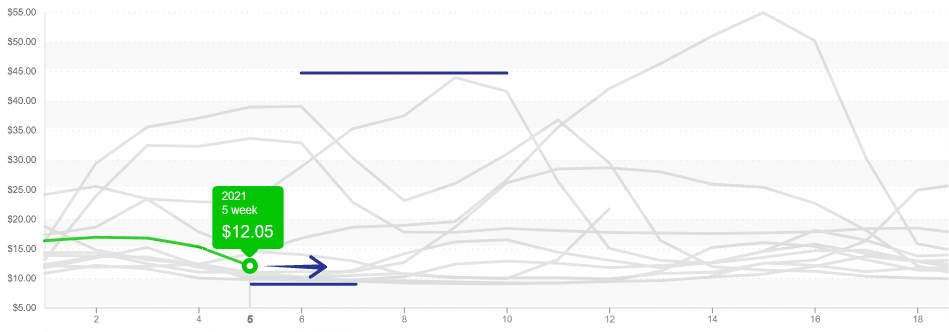
Fortunately for buyers, hard squash may be had for a bargain. Excluding small sizes, which are at even lower prices, butternut squash declined below $10/box. Historical trends indicate prices will rise through March and then begin a descent that ends with production before summer arrives.

Butternut squash hasn’t begun to climb yet. Growers hope that the down year of 2017, which created a $6 floor, isn’t repeated.
Tomatoes are feeling the most pain with category prices falling -22 percent as production ramps up in both Florida and Mexico. Tomato suspension agreement floor prices are being tested at both shipping point and destination markets.
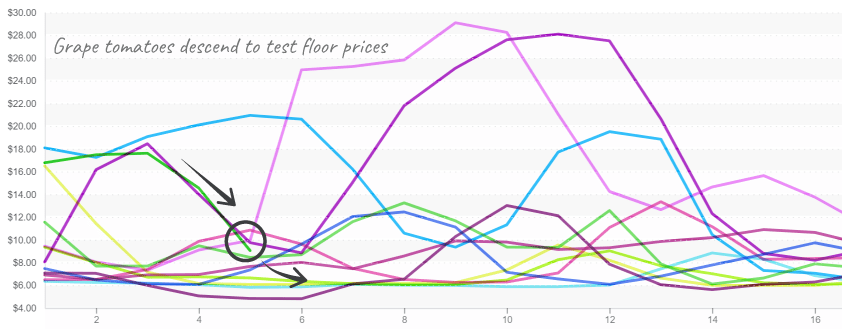
TSA’s reference price for grape (specialty) tomatoes in packaging is $0.59 /lb., or approximately $5 per box assuming a flats box of 12 one-pint clamshells weighs 8 pounds. Grape tomato prices recently fell from $18 to $8 per box within two weeks. Mexican production is sufficient to outpace demand.

Grape tomato prices head south as Mexico increases the production heading north.
Celery, broccoli, lettuces, asparagus, pepper, and squash are all down double-digit percentages. The snowstorm’s reduction of quantity demand dramatically impacts price. All of these commodities are now at the low end of their trading ranges and require increased demand for prices to begin climbing upward again.

Romaine lettuce has “binary” mid-winter pricing, and this year is hovering over the low end of the range.
The graphs above are created using free online tools at ProduceIQ. Please visit to slice the data your way.
We seek all feedback.
ProduceIQ Index
The ProduceIQ Index is the fresh produce industry’s only shipping point price index. It represents the industry-wide price per pound at the location of packing for domestic produce, and at the port of U.S. entry for imported produce.
ProduceIQ uses 40 top commodities to represent the industry. The Index weights each commodity dynamically, by season, as a function of the weekly 5-year rolling average Sales. Sales are calculated using the USDA’s Agricultural Marketing Service for movement and price data. The Index serves as a fair benchmark for industry price performance.
Prices for the overall ProduceIQ Index were deceptively buoyed by grapes and berries.
While most categories suffered, grapes and berries increased 8.1 percent, continuing to outperform other commodities before Valentine’s Day.
The spot market, for the remainder of the industry, fell dormant as the Northeastern U.S. was slammed with a major winter storm. The storm was so severe it led to the partial closing of Hunts Point, the Bronx wholesale produce market famous for remaining open 365 days a year.
Snow fall varied by location, spanning from only a few inches to a recorded 32 inches in New Jersey. Unfortunately for foodservice, Nor’easters and outdoor dining are proving to be incompatible.
ProduceIQ Index: $0.99 /pound, +4.2 percent over prior week
(Week #5, ending February 5th)
Blue Book has teamed with ProduceIQ BB #:368175 to bring the ProduceIQ Index to its readers. The index provides a produce industry price benchmark using 40 top commodities to provide data for decision making.
When hot soup is preferred over cold salad, it’s time to sell more butternut squash.
Fortunately for buyers, hard squash may be had for a bargain. Excluding small sizes, which are at even lower prices, butternut squash declined below $10/box. Historical trends indicate prices will rise through March and then begin a descent that ends with production before summer arrives.

Butternut squash hasn’t begun to climb yet. Growers hope that the down year of 2017, which created a $6 floor, isn’t repeated.
Tomatoes are feeling the most pain with category prices falling -22 percent as production ramps up in both Florida and Mexico. Tomato suspension agreement floor prices are being tested at both shipping point and destination markets.
TSA’s reference price for grape (specialty) tomatoes in packaging is $0.59 /lb., or approximately $5 per box assuming a flats box of 12 one-pint clamshells weighs 8 pounds. Grape tomato prices recently fell from $18 to $8 per box within two weeks. Mexican production is sufficient to outpace demand.

Grape tomato prices head south as Mexico increases the production heading north.
Celery, broccoli, lettuces, asparagus, pepper, and squash are all down double-digit percentages. The snowstorm’s reduction of quantity demand dramatically impacts price. All of these commodities are now at the low end of their trading ranges and require increased demand for prices to begin climbing upward again.

Romaine lettuce has “binary” mid-winter pricing, and this year is hovering over the low end of the range.
The graphs above are created using free online tools at ProduceIQ. Please visit to slice the data your way.
We seek all feedback.
ProduceIQ Index
The ProduceIQ Index is the fresh produce industry’s only shipping point price index. It represents the industry-wide price per pound at the location of packing for domestic produce, and at the port of U.S. entry for imported produce.
ProduceIQ uses 40 top commodities to represent the industry. The Index weights each commodity dynamically, by season, as a function of the weekly 5-year rolling average Sales. Sales are calculated using the USDA’s Agricultural Marketing Service for movement and price data. The Index serves as a fair benchmark for industry price performance.
Mark Campbell was introduced to the fresh produce industry as a lender for Farm Credit. After earning his MBA from Columbia Business School, he spent seven years as CFO for J&J Family of Farms and later served as CFO advisor to several produce growers, shippers and distributors. In this role, Mark saw the impediments that prevent produce growers and buyers to trade with greater access and efficiency. This led him to cofound ProduceIQ.


