As the end of the year 2020 grows closer, the numbers for avocado consumption keep growing.
In a year that most of the industries have been affected negatively by the COVID-19 crisis, the produce industry has several items, and one in particular, which is growing in double digits.
That is, the avocado.
As the consumers care more about their health and are eating at home, products such as the avocado are included in meals on a more regular basis.
Blue Book has teamed with Agtools Inc., BB #:355102 the data analytic service for the produce industry, to look how a fruit or vegetable fared in 2020 and what it should expect next year.
3 YEAR COMPARISION OF WEEKLY VOLUME OF AVOCADO MARKET
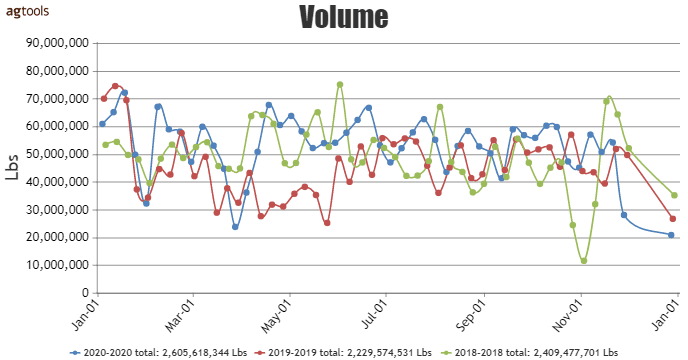
Comparing the last three years, 2018 was a strong season, then in 2019 the volume decreased, but in 2020 the market recovered, and the growth looks very strong.
As we can observe, when the pandemic lockdown in March was declared, the volume dropped to its lowest point of the year, but after that point the volume ramped up very fast and kept the growth almost every week of the rest of the year higher than in 2019.
WEEKLY VOLUME OF THE 4 MAIN SUPPLYING REGIONS
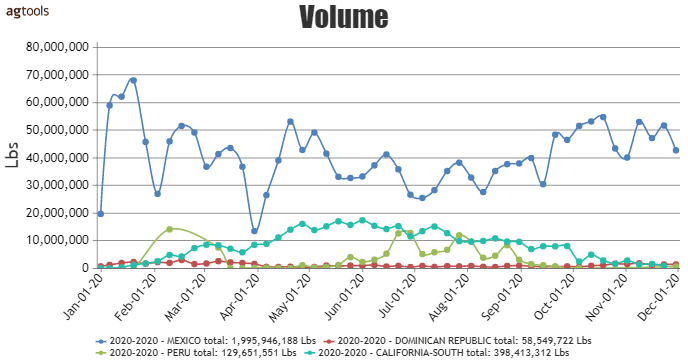
Breaking down the volume by region, California South is close behind Mexico in terms of production, during almost every week of the year and peaking in late spring.
Peru has two main production periods: February and the months of May, June and July. These two regions of Peru and California South have their biggest volume when Mexico reduces its production. The Dominican Republic has a small volume almost all year round.
VOLUME COMPARISION BETWEEN AVOCADOS AND TOMATOES IN 2015
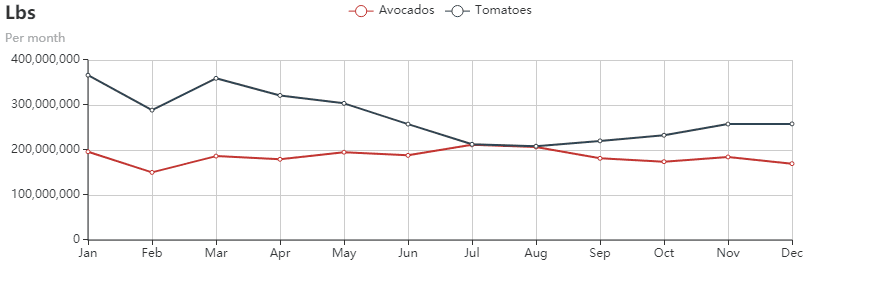
The growth of the avocado market is remarkable. As a benchmark, comparing the avocado and round tomato, in 2015 the spread in volume between these two commodities was significant, except in July and August, when the tomatoes demand hit its lowest point.
VOLUME COMPARISON BETWEEN AVOCADO AND TOMATO IN 2020
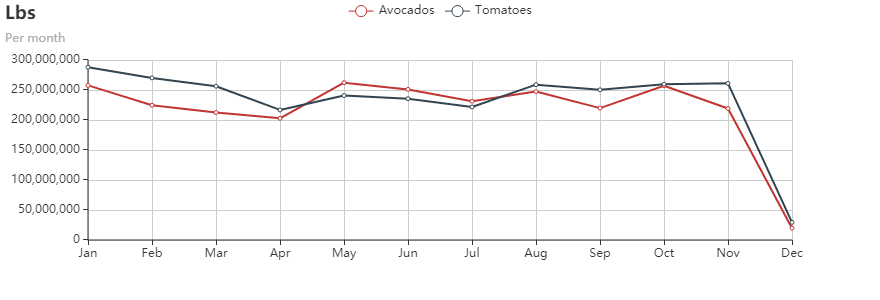
After five years, the spread between these two commodities has been reduced drastically. During 2020 the avocado volume surpassed the tomato volume during the spring-summer and were very close almost every month. It is remarkable the marketing effort that this commodity has received in the last few years.
If this type of efforts continues, it is easy to understand that the market will increase and consolidate these numbers.
F.O.B. MC ALLEN TX. PRICE FOR AVOCADOS FROM MEXICO SIZE 48´S
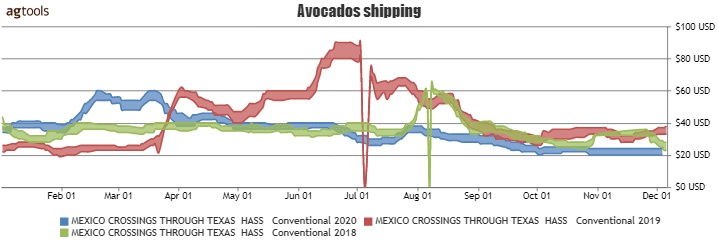
Regarding prices, this year has had no peaks and valleys such as in 2019, when they peaked over $80 per case. The peak prices in 2020 were before the lockdown, and after that, the trend has been downward through the year even below the pricing in 2018.
The increase in volume and affordable prices, may help to increase the consumption and help the market to grow.
CHICAGO TERMINAL MARKET PRICE FOR AVOCADOS FROM MEXICO SIZE 48´S
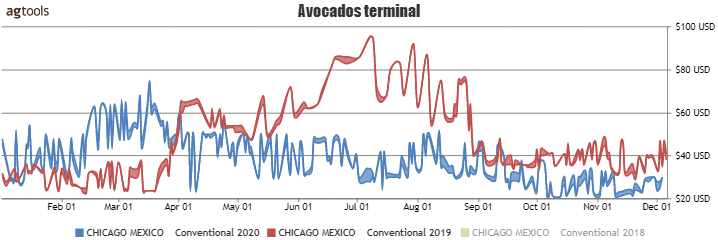
As a result of the F.O.B. prices, the Chicago terminal also showed the same trend and the difference between 2020 and 2019, when prices were historically high. This year prices are the lowest of the last three years. This same trend can be observed in any terminal market.
Compared to the 2019 prices, all terminal markets have more affordable prices, resulting in a potential market increase.
RETAIL PRICES COMPARISON BETWEEN 2019 AND 2020

In contrast to wholesale prices, retail prices by unit have not reflected much of a margin difference over the last two years. The consumer has not received the benefit of the low wholesale prices in 2020.
The differences in 2019 and 2020 in prices and available volume should be driver to push retail prices down and increase usage of avocados at all levels throughout the year and not only on Super Bowl Sunday.
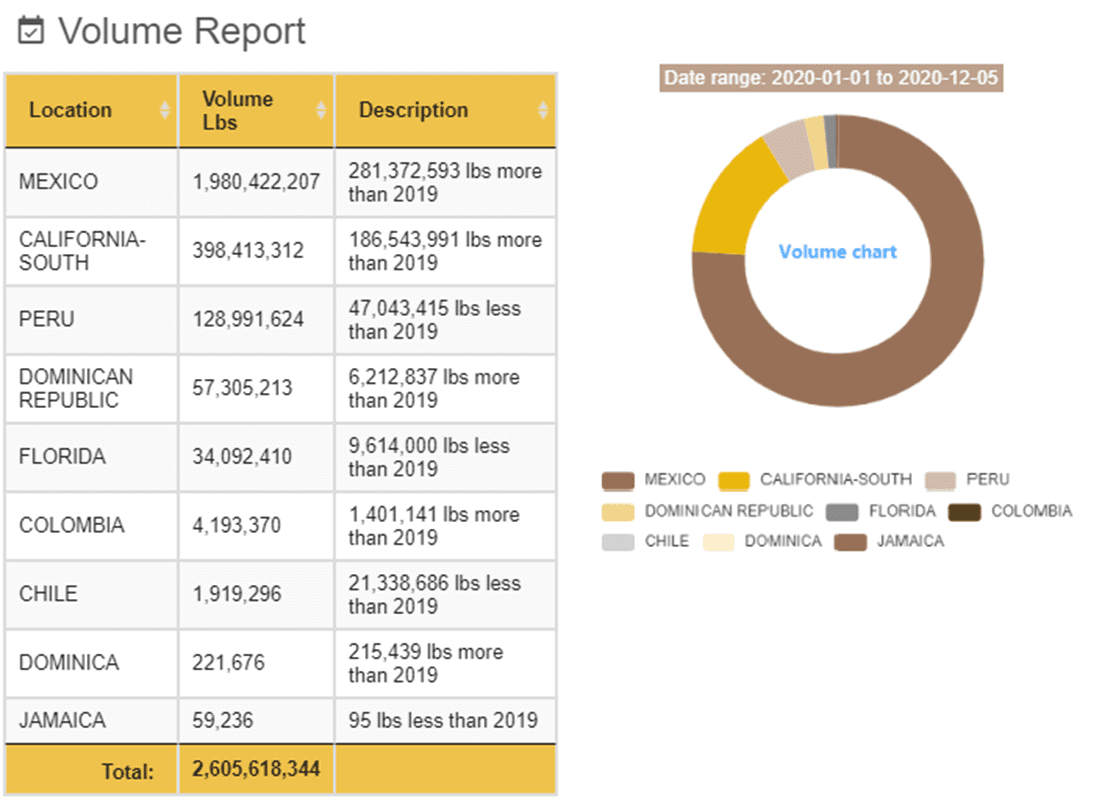
Mexico continues to be the main supplier for the U.S. with a market share of 76 percent. This region is in the middle of the growing season, so there is a strong possibility that during December it will still be the leading source through the end of the year. Southern California holds 15 percent and Peru almost 5 percent. The rest is divided in several small regions.
GROWTH AND MARKET SHARE BY REGION

The 2020 YTD volume shows a total growth of more than 16 percent compared to 2019 with almost 400 million pounds more this year. Southern California increased its market share from 9.5 percent in 2019 to 15.2 percent in 2020.
Even with the pandemic effect and all the disruption that the crisis has brought to our lives this year, the avocado has become an extremely popular item in the consumer’s diet. Many are now eating this product in different recipes such as guacamole, salsa, salads, etc.
As the end of the year 2020 grows closer, the numbers for avocado consumption keep growing.
In a year that most of the industries have been affected negatively by the COVID-19 crisis, the produce industry has several items, and one in particular, which is growing in double digits.
That is, the avocado.
As the consumers care more about their health and are eating at home, products such as the avocado are included in meals on a more regular basis.
Blue Book has teamed with Agtools Inc., BB #:355102 the data analytic service for the produce industry, to look how a fruit or vegetable fared in 2020 and what it should expect next year.
3 YEAR COMPARISION OF WEEKLY VOLUME OF AVOCADO MARKET

Comparing the last three years, 2018 was a strong season, then in 2019 the volume decreased, but in 2020 the market recovered, and the growth looks very strong.
As we can observe, when the pandemic lockdown in March was declared, the volume dropped to its lowest point of the year, but after that point the volume ramped up very fast and kept the growth almost every week of the rest of the year higher than in 2019.
WEEKLY VOLUME OF THE 4 MAIN SUPPLYING REGIONS

Breaking down the volume by region, California South is close behind Mexico in terms of production, during almost every week of the year and peaking in late spring.
Peru has two main production periods: February and the months of May, June and July. These two regions of Peru and California South have their biggest volume when Mexico reduces its production. The Dominican Republic has a small volume almost all year round.
VOLUME COMPARISION BETWEEN AVOCADOS AND TOMATOES IN 2015

The growth of the avocado market is remarkable. As a benchmark, comparing the avocado and round tomato, in 2015 the spread in volume between these two commodities was significant, except in July and August, when the tomatoes demand hit its lowest point.
VOLUME COMPARISON BETWEEN AVOCADO AND TOMATO IN 2020

After five years, the spread between these two commodities has been reduced drastically. During 2020 the avocado volume surpassed the tomato volume during the spring-summer and were very close almost every month. It is remarkable the marketing effort that this commodity has received in the last few years.
If this type of efforts continues, it is easy to understand that the market will increase and consolidate these numbers.
F.O.B. MC ALLEN TX. PRICE FOR AVOCADOS FROM MEXICO SIZE 48´S

Regarding prices, this year has had no peaks and valleys such as in 2019, when they peaked over $80 per case. The peak prices in 2020 were before the lockdown, and after that, the trend has been downward through the year even below the pricing in 2018.
The increase in volume and affordable prices, may help to increase the consumption and help the market to grow.
CHICAGO TERMINAL MARKET PRICE FOR AVOCADOS FROM MEXICO SIZE 48´S

As a result of the F.O.B. prices, the Chicago terminal also showed the same trend and the difference between 2020 and 2019, when prices were historically high. This year prices are the lowest of the last three years. This same trend can be observed in any terminal market.
Compared to the 2019 prices, all terminal markets have more affordable prices, resulting in a potential market increase.
RETAIL PRICES COMPARISON BETWEEN 2019 AND 2020

In contrast to wholesale prices, retail prices by unit have not reflected much of a margin difference over the last two years. The consumer has not received the benefit of the low wholesale prices in 2020.
The differences in 2019 and 2020 in prices and available volume should be driver to push retail prices down and increase usage of avocados at all levels throughout the year and not only on Super Bowl Sunday.

Mexico continues to be the main supplier for the U.S. with a market share of 76 percent. This region is in the middle of the growing season, so there is a strong possibility that during December it will still be the leading source through the end of the year. Southern California holds 15 percent and Peru almost 5 percent. The rest is divided in several small regions.
GROWTH AND MARKET SHARE BY REGION

The 2020 YTD volume shows a total growth of more than 16 percent compared to 2019 with almost 400 million pounds more this year. Southern California increased its market share from 9.5 percent in 2019 to 15.2 percent in 2020.
Even with the pandemic effect and all the disruption that the crisis has brought to our lives this year, the avocado has become an extremely popular item in the consumer’s diet. Many are now eating this product in different recipes such as guacamole, salsa, salads, etc.
Raul Lopez is vice president of Agtools in Mexico and an agronomist with more than 30 years of experience in the perishables industry


