This summer’s kale volume has been steady, as has pricing, but it has failed to live up to 2018, when volume was more than 25 percent higher.
Kale had its moment in the spotlight, but like many other stars find out, fame can be fleeting.
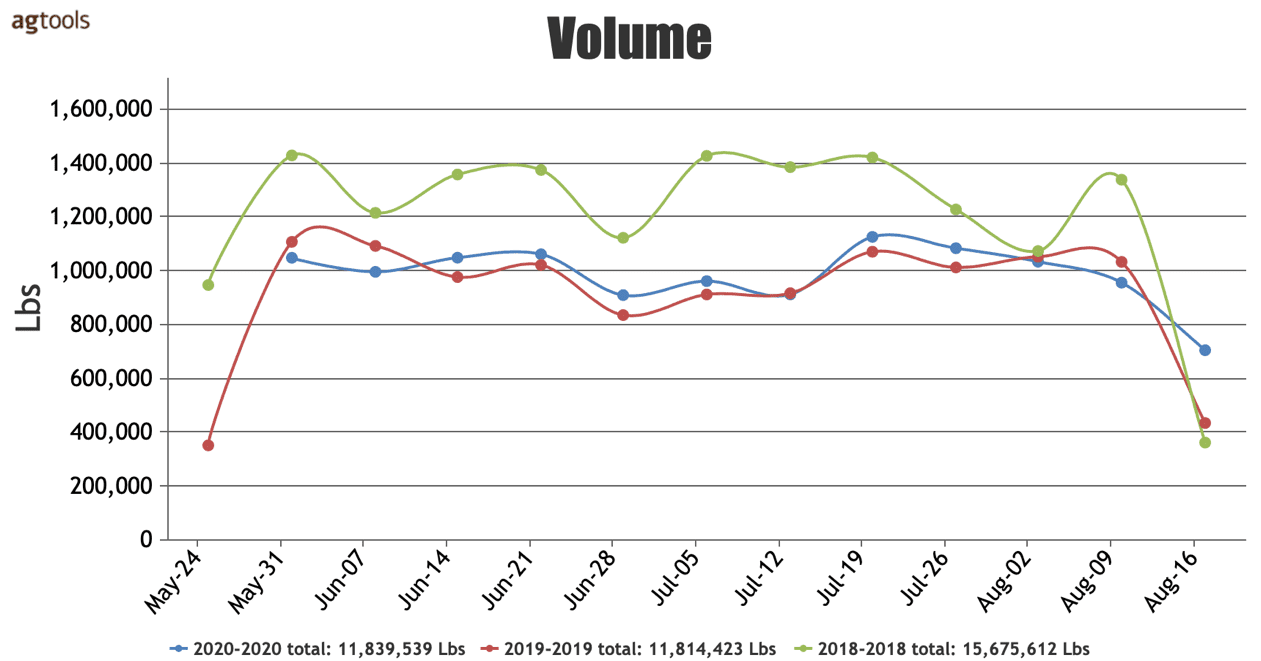
VOLUME TOTAL, KALE GREENS CONVENTIONAL FROM JUNE 1ST THROUGH AUGUST 21TH

A comparison of 2020 volume with 2019 and 2018, for the period between June and August 21, 2020, we see volume levels similar to 2019, with only a slight 25 thousand pound difference. Yet, the drop in consumption from 2018 to 2019 is significant, when volume decreased close to 27 percent. said Paola Ochoa, Program Manager for Agtools Inc. BB #:355102
Blue Book has teamed with Agtools Inc., the data analytic service for the produce industry, to look at a handful of crops and how they’re adjusting in the market during the pandemic.
F.O.B. PRICE IN CENTRAL COAST CALIFORNIA KALE GREENS CONVENTIONAL FROM JUNE 1ST THROUGH AUGUST 22TH

During the last three years the price of kale greens has been very stable, notwithstanding the significant volume decrease from 2018 into 2019, Ochoa said. The price has remained $6-10 in each of the last three years during the analyzed period, with only temporary drops followed by immediate recoveries.
NEW YORK TERMINAL PRICE FOR CONVENTIONAL KALE GREENS FROM JUNE 1ST THROUGH AUGUST 21TH

Different to the F.O.B. price in the New York terminal for 2019, Ochoa said, this year’s prices have been higher for most of the analyzed period. The only exception was a brief period during the middle of July when prices dropped to a low of $11.
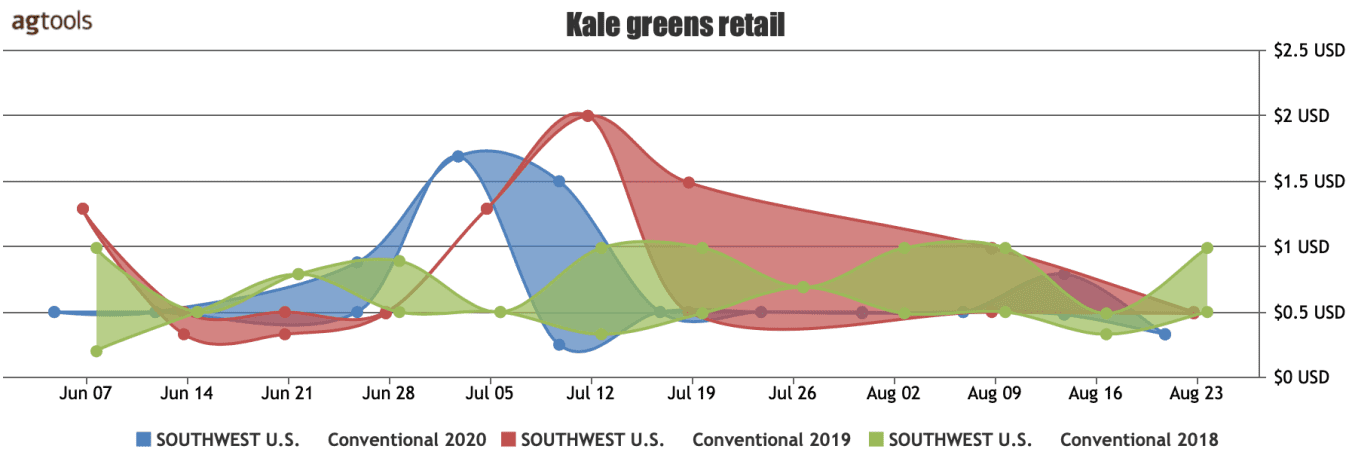
SOUTHWEST RETAIL PRICE FOR CONVENTIONAL KALE GREENS FROM JUNE 1ST THROUGH AUGUST 21TH

The retail price in the Southwest has been very volatile this year, similar to last year’s behavior, Ochoa said. The significant shifts were most pronounced during the month of June, with a range between $1.75 and $0.35 which happened in consecutive weeks.
2020 YTD Kale Greens
Together, South Carolina, Mexico and California South account for 61.7 percent of the U.S. consumption of Kale Greens, with South Carolina the largest producer with 24.7 percent of total US volume. The regions of California Central, Texas and Arizona are the next group of producers for the US in terms of volume. These six supplying regions are responsible for almost the entire U.S. volume.
This summer’s kale volume has been steady, as has pricing, but it has failed to live up to 2018, when volume was more than 25 percent higher.
Kale had its moment in the spotlight, but like many other stars find out, fame can be fleeting.
VOLUME TOTAL, KALE GREENS CONVENTIONAL FROM JUNE 1ST THROUGH AUGUST 21TH

A comparison of 2020 volume with 2019 and 2018, for the period between June and August 21, 2020, we see volume levels similar to 2019, with only a slight 25 thousand pound difference. Yet, the drop in consumption from 2018 to 2019 is significant, when volume decreased close to 27 percent. said Paola Ochoa, Program Manager for Agtools Inc. BB #:355102
Blue Book has teamed with Agtools Inc., the data analytic service for the produce industry, to look at a handful of crops and how they’re adjusting in the market during the pandemic.
F.O.B. PRICE IN CENTRAL COAST CALIFORNIA KALE GREENS CONVENTIONAL FROM JUNE 1ST THROUGH AUGUST 22TH

During the last three years the price of kale greens has been very stable, notwithstanding the significant volume decrease from 2018 into 2019, Ochoa said. The price has remained $6-10 in each of the last three years during the analyzed period, with only temporary drops followed by immediate recoveries.
NEW YORK TERMINAL PRICE FOR CONVENTIONAL KALE GREENS FROM JUNE 1ST THROUGH AUGUST 21TH

Different to the F.O.B. price in the New York terminal for 2019, Ochoa said, this year’s prices have been higher for most of the analyzed period. The only exception was a brief period during the middle of July when prices dropped to a low of $11.
SOUTHWEST RETAIL PRICE FOR CONVENTIONAL KALE GREENS FROM JUNE 1ST THROUGH AUGUST 21TH

The retail price in the Southwest has been very volatile this year, similar to last year’s behavior, Ochoa said. The significant shifts were most pronounced during the month of June, with a range between $1.75 and $0.35 which happened in consecutive weeks.
2020 YTD Kale Greens
Together, South Carolina, Mexico and California South account for 61.7 percent of the U.S. consumption of Kale Greens, with South Carolina the largest producer with 24.7 percent of total US volume. The regions of California Central, Texas and Arizona are the next group of producers for the US in terms of volume. These six supplying regions are responsible for almost the entire U.S. volume.
Greg Johnson is Director of Media Development for Blue Book Services


