Volume has shifted seasonally from Southern to Central California.
VOLUME TOTAL, CELERY CONVENTIONAL FROM MAY 1ST THROUGH JULY 15TH
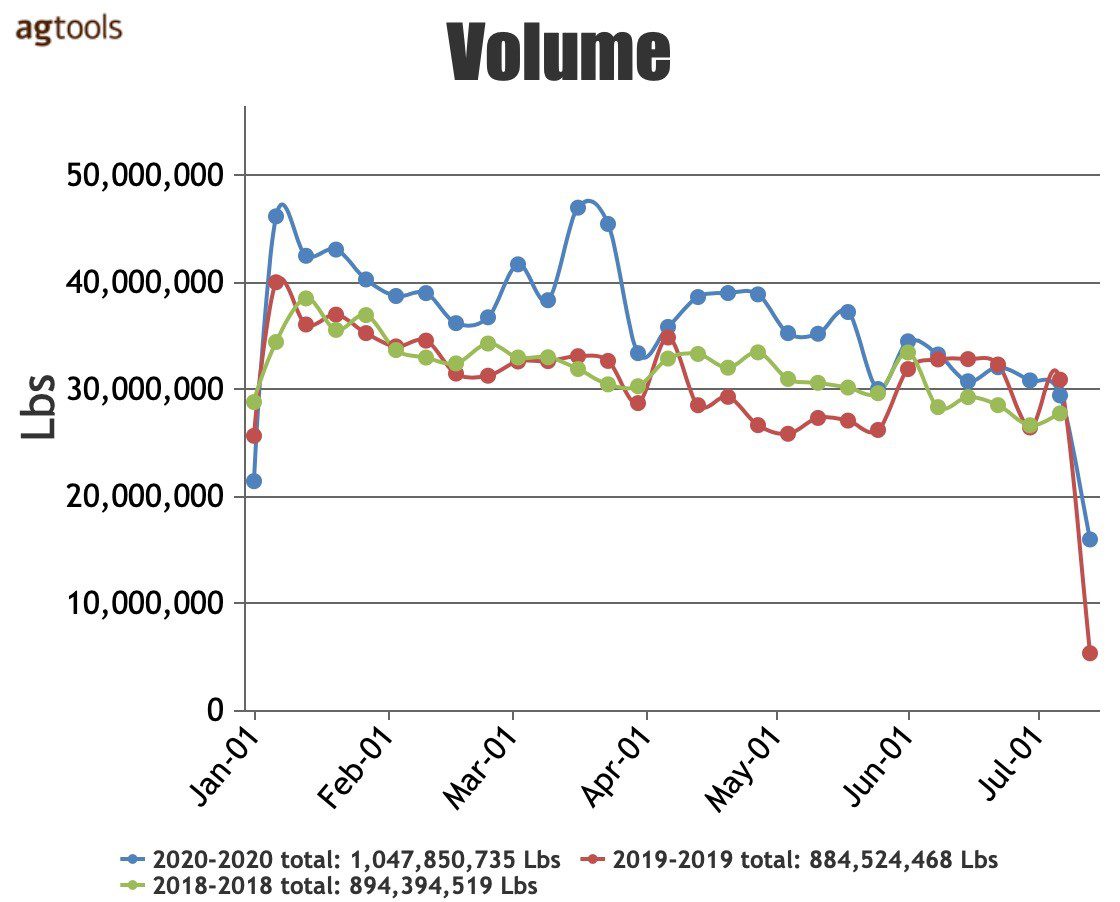
When comparing 2020 volume from May to July 15 we see an increase of 18 percent over 2019 and an increase of 17 percent over 2018. We can see how the celery market, unlike other commodities, did not suffer a drop in supply or demand as a result of the pandemic which affected other products starting in the middle of March, said Paola Ochoa, program manager for Agtools Inc.
Blue Book has teamed with Agtools Inc., the data analytic service for the produce industry, to look at a handful of crops and how they’re adjusting in the market during the pandemic.
SEASONALITY CHANGE IN CALIFORNIA
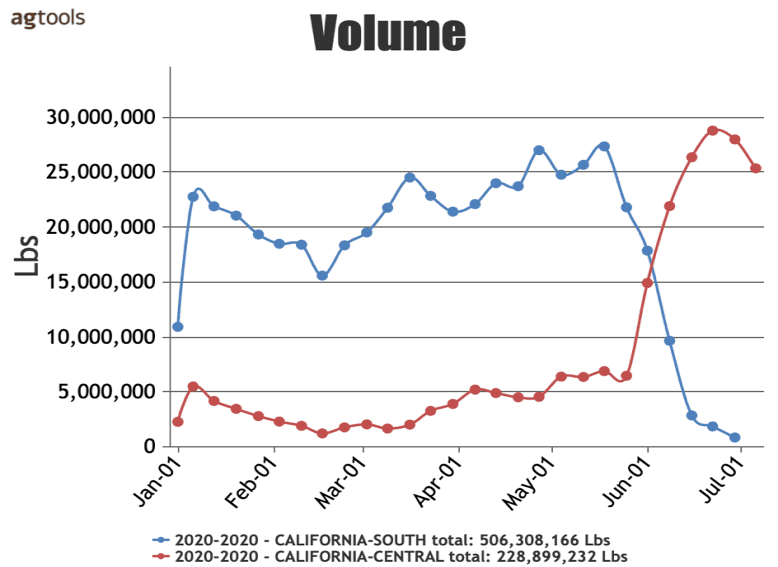
Over the last 6 weeks production shifted between California regions. As the season in the south approached its end, Central began to take over. The production of Central California (Salinas, Watsonville and Santa Maria) took over volume at the beginning of June, consistent with the yearly pattern, Ochoa said.
F.O.B. PRICE IN SALINAS -WATSONVILLE CALIFORNIA CELERY CONVENTIONAL SIZE 2DZ FROM JUNE 1ST THROUGH JULY 15TH
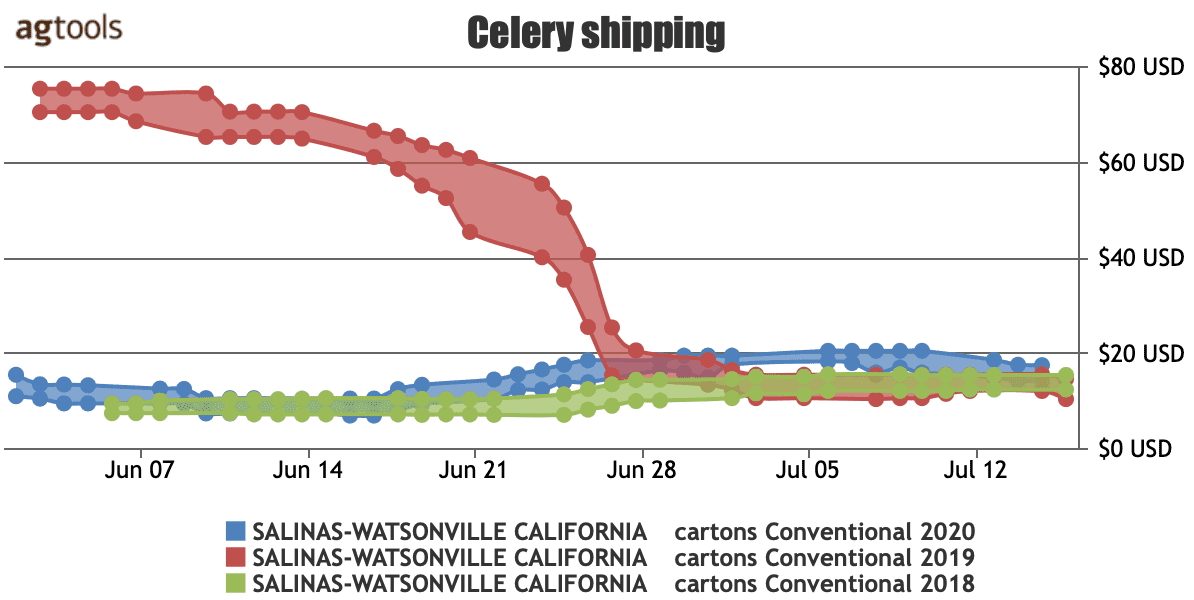
Since the beginning of June, F.O.B. prices have remained within a range of about $10 for the lowest and $20 at the high end. This year’s pricing is at similar levels as that of 2018, Ochoa said.
The unusually high prices of June 2019 were a direct result of lower supply and higher demand for celery. Demand spiked due in part to the dietary virtues associated with the vegetable, but supply in 2019 was severely affected by unusual weather patterns.
In the east the driest fall on record led to smaller sizes than usual. In the west, temperatures warmer than expected were followed by colder than normal temperatures, rain and wind, which slowed and damaged celery crops.
F.O.B. PRICE IN SANTA MARIA VS SALINAS CELERY CONVENTIONAL SIZE 2DZ FROM JUNE 1ST TROUGH JULY 15TH

The high end of the pricing range for product from Salina-Watsonville has consistently surpassed the high end of the pricing range for product from Santa María, Ochoa said.
CHICAGO TERMINAL MARKET PRICE FOR CELERY CONVENTIONAL SIZE 2DZ FROM JUNE 1ST TROUGH JULY 15TH
3RD
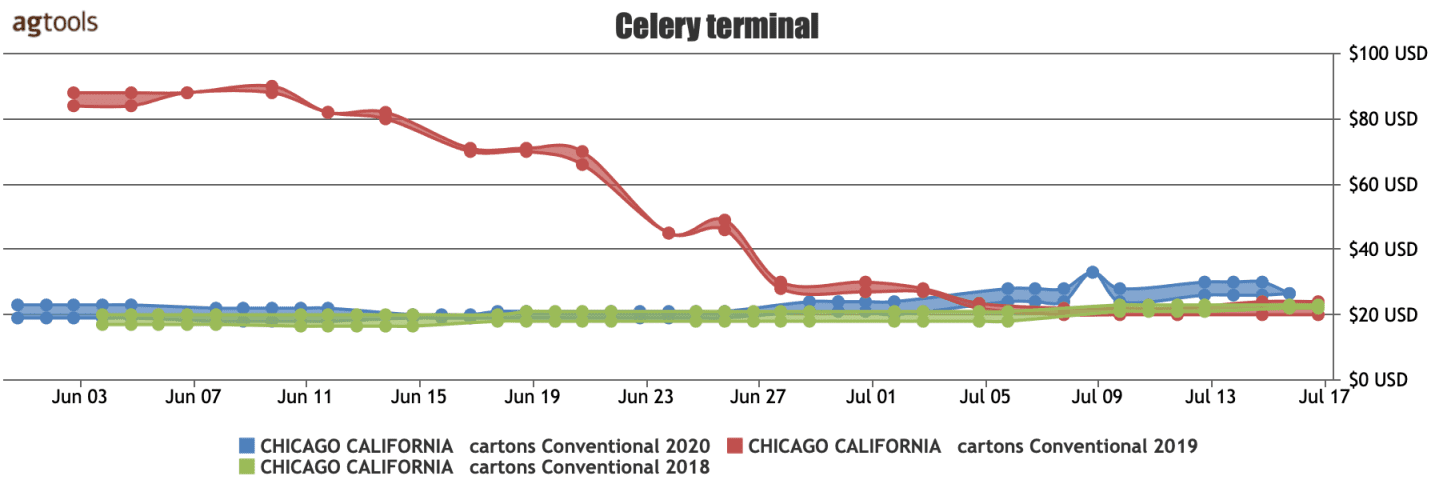
In Chicago, the terminal market pricing trend was very similar to that of F.O.B. prices for the 2020 and the 2018 season. Also evident from the data is the 350 percent increase in terminal price from 2018 to 2019, which was a direct result of the lower supply conditions discussed in a previous section, Ochoa said.
The disruption in the supply chain caused by unusual, and in some cases extreme, weather patterns is evidently reflected in terminal prices as can be seen by the similarity between the FOB pricing graph and the Chicago Terminal Pricing graph.
2020 YTD Celery
California is consistently the highest producer of celery consumed in the United States, Ochoa said.
In 2020, the region accounted for 93.5 percent of the market and consistently provides over 90 percent of the country’s consumption. After California, the second region with the highest volume is Mexico with 6 percent. Together Mexico and California account for almost all production, at over 99 percent of U.S. celery consumption.
Volume has shifted seasonally from Southern to Central California.
VOLUME TOTAL, CELERY CONVENTIONAL FROM MAY 1ST THROUGH JULY 15TH

When comparing 2020 volume from May to July 15 we see an increase of 18 percent over 2019 and an increase of 17 percent over 2018. We can see how the celery market, unlike other commodities, did not suffer a drop in supply or demand as a result of the pandemic which affected other products starting in the middle of March, said Paola Ochoa, program manager for Agtools Inc.
Blue Book has teamed with Agtools Inc., the data analytic service for the produce industry, to look at a handful of crops and how they’re adjusting in the market during the pandemic.
SEASONALITY CHANGE IN CALIFORNIA

Over the last 6 weeks production shifted between California regions. As the season in the south approached its end, Central began to take over. The production of Central California (Salinas, Watsonville and Santa Maria) took over volume at the beginning of June, consistent with the yearly pattern, Ochoa said.
F.O.B. PRICE IN SALINAS -WATSONVILLE CALIFORNIA CELERY CONVENTIONAL SIZE 2DZ FROM JUNE 1ST THROUGH JULY 15TH

Since the beginning of June, F.O.B. prices have remained within a range of about $10 for the lowest and $20 at the high end. This year’s pricing is at similar levels as that of 2018, Ochoa said.
The unusually high prices of June 2019 were a direct result of lower supply and higher demand for celery. Demand spiked due in part to the dietary virtues associated with the vegetable, but supply in 2019 was severely affected by unusual weather patterns.
In the east the driest fall on record led to smaller sizes than usual. In the west, temperatures warmer than expected were followed by colder than normal temperatures, rain and wind, which slowed and damaged celery crops.
F.O.B. PRICE IN SANTA MARIA VS SALINAS CELERY CONVENTIONAL SIZE 2DZ FROM JUNE 1ST TROUGH JULY 15TH

The high end of the pricing range for product from Salina-Watsonville has consistently surpassed the high end of the pricing range for product from Santa María, Ochoa said.
CHICAGO TERMINAL MARKET PRICE FOR CELERY CONVENTIONAL SIZE 2DZ FROM JUNE 1ST TROUGH JULY 15TH
3RD

In Chicago, the terminal market pricing trend was very similar to that of F.O.B. prices for the 2020 and the 2018 season. Also evident from the data is the 350 percent increase in terminal price from 2018 to 2019, which was a direct result of the lower supply conditions discussed in a previous section, Ochoa said.
The disruption in the supply chain caused by unusual, and in some cases extreme, weather patterns is evidently reflected in terminal prices as can be seen by the similarity between the FOB pricing graph and the Chicago Terminal Pricing graph.
2020 YTD Celery
California is consistently the highest producer of celery consumed in the United States, Ochoa said.
In 2020, the region accounted for 93.5 percent of the market and consistently provides over 90 percent of the country’s consumption. After California, the second region with the highest volume is Mexico with 6 percent. Together Mexico and California account for almost all production, at over 99 percent of U.S. celery consumption.
Greg Johnson is Director of Media Development for Blue Book Services


