A few heavy volume commodities held big numbers this week, preventing an industry-wide collapse in prices.
Supplier discipline kept the high volume, less-perishable items from falling; avocados, most fruit, and the “hardware” items of potatoes and onions are holding.
This week should be a turning point for the highly perishables. The Thanksgiving pause will soon give way to the December holiday rush.
Blue Book has teamed with ProduceIQ BB #:368175 to bring the ProduceIQ Index to its readers. The index provides a produce industry price benchmark using 40 top commodities to provide data for decision making.
ProduceIQ Index: $0.98/pound, -4.9 percent over prior week
Week #49, ending December 10th
Even with increasing demand, uncertainty remains due to continued challenges with freight. Having produce at the border doesn’t help anyone if it can’t find a ride to destination markets.
Nogales, AZ, is ramping up, and trucks remain in short supply. The most significant price declines are in commodities dominated by Yuma and Nogales; broccoli, cauliflower, romaine, iceberg, tomatoes, peppers, and squash are experiencing double-digit percentage price reductions.
It’s that time of year again. No, not Christmas; it’s the season the Tomato Suspension Agreement begins to creep back towards the front of the fresh produce news cycle. The TSA would be a non-issue if market prices wouldn’t otherwise fall below the floor.
The tomato category is experiencing significant price decreases across all varieties this week. Plum tomatoes lost half their value, falling from a peak of $23.30 to $10.15 since Thanksgiving.
Larger volumes out of Florida and moderate demand are pushing prices lower. Last week, Florida tomato volume even surpassed Mexican production.

Plum (Roma) tomato harvests from Mexico and Florida overlap to wreak havoc.
On the other hand, Hass avocados are at a ten-year high. Increasing demand for smaller-sized fruit and light volumes for larger ones adds pressure to already tense avocado markets.
The eminent future of avocado prices is uncertain, though growers and importers are waiting patiently. Prices could continue to increase in response to snowballing holiday demand. The only risk to prices is that an abundant fruit set is reportedly on the trees, giving rise to the potential for reduced grower discipline and a surge in volume.

Avocados (Hass 48ct) follow 2017’s price pattern, which resulted in mid-range prices during the spring of 2018.
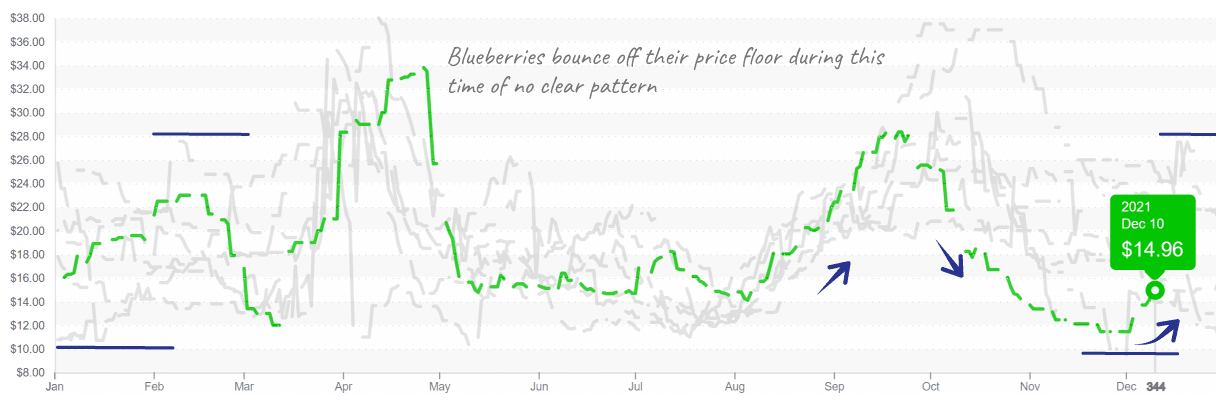
An incredible Peruvian blueberry harvest is pushing prices to a ten-year low. While Mexican production of blueberries is slightly lower than previous year’s volumes, Peruvian production of blueberries is increasing. As a result, prices may rise somewhat in response to growing holiday demand but should remain on the lower end of historical precedent.

Blueberries enter winter with less clear price patterns, abundant supply, and low prices.
Another member of the ProduceIQ Grapes & Berries category is at a ten-year low. Raspberries prices, brought down by a solid Mexican harvest, are promotable in most regions of the United States. Like blueberries, raspberry prices are forecasted to remain promotable throughout the holiday season.
Strawberry markets are split. Varying quality and volumes make for an extremely competitive market despite moderate pricing. Mexican and Florida’s strawberry growers are seeing lower week #49 volumes than previous years.
Unable to meet demand, eastern suppliers are relying on product from Oxnard and Santa Maria to stock shelves. Although western volumes are typical for this time of year, Californian strawberries are experiencing quality issues. As Florida growers pick up production, pricing should grow more consistent.
Please visit our online marketplace here and enjoy free access to our market tools which created the graphs above.
ProduceIQ Index
The ProduceIQ Index is the fresh produce industry’s only shipping point price index. It represents the industry-wide price per pound at the location of packing for domestic produce, and at the port of U.S. entry for imported produce.
ProduceIQ uses 40 top commodities to represent the industry. The Index weights each commodity dynamically, by season, as a function of the weekly 5-year rolling average Sales. Sales are calculated using the USDA’s Agricultural Marketing Service for movement and price data. The Index serves as a fair benchmark for industry price performance.


