Winter is making up for lost time. Back-to-back storms Ember and Finn brought wintery weather to most of the United States over the weekend, including ice to lettuce-growing regions in Arizona and more rain for water-logged Florida.
In addition, Ember and Finn’s inclement weather is causing minor supply disruptions due to icy travel conditions.
The continental U.S. started 2024 with the least snow cover since 2003. It’s odd since El Niño typically prompts wetter-than-average winters in the West and South. The dry start does not necessarily indicate greater trends for the rest of winter but is certainly triggering for recently recovered drought-afflicted growers in the West.
It seems Ember and Finn may be the prequel. Mid-week, a big blast of arctic air will plunge most of the U.S. into below-average temperatures.
ProduceIQ Index begins the new year at $1.37, a whopping 19 percent higher than 2023 began ($1.15 per pound).
ProduceIQ Index: $1.37/pound, flat over prior week
(Week #1, ending January 5th)
Blue Book has teamed with ProduceIQ BB #:368175 to bring the ProduceIQ Index to its readers. The index provides a produce industry price benchmark using 40 top commodities to provide data for decision making.
Miserly demand is holding oil prices at bay despite supply disruptions in the Red Sea. Shipping container rates, however, have doubled in response to disruptions triggered by the conflict in Gaza and the drought causing a lack of water for the Panama Canal.
Before you get too pessimistic about 2024’s prospects, keep in mind that rates are nowhere near the prices seen due to pandemic-related disturbances.
Increasing shipping costs adds more pressure to U.S. winter produce prices by increasing input and transportation expenses for suppliers and buyers. Winter produce markets rely on supply from growers in Chile and Peru for high-value commodities such as blueberries, grapes, citrus, and mangoes.
Speaking of blueberries, we wish we had better news for you buyers, but the odds are not in your favor. Chile is done, and Peru has yet to ramp up. The gap in supply is keeping blueberry prices perilously high, and containers are taking their time to arrive due to delays in the Panama Canal.
Import volume from South America is less than half of the volume in week #1 of 2023. Suppliers are reporting crossing should increase towards the end of January.
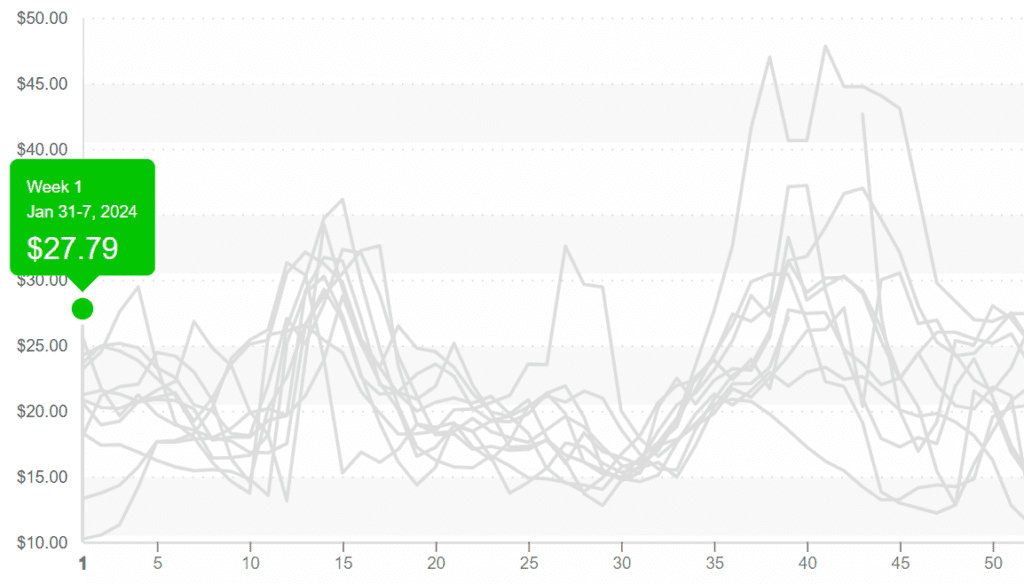
Blueberry prices begin the year at record highs, $27, but usually trend downward for the next eight weeks.

Strawberry prices inch higher as rain and cold quell New Year enthusiasm. Demand exceeds supply in the East and West due to labor and weather-related challenges. Don’t lose hope yet. Like being pulled by gravity, strawberry prices should fall by the end of January.
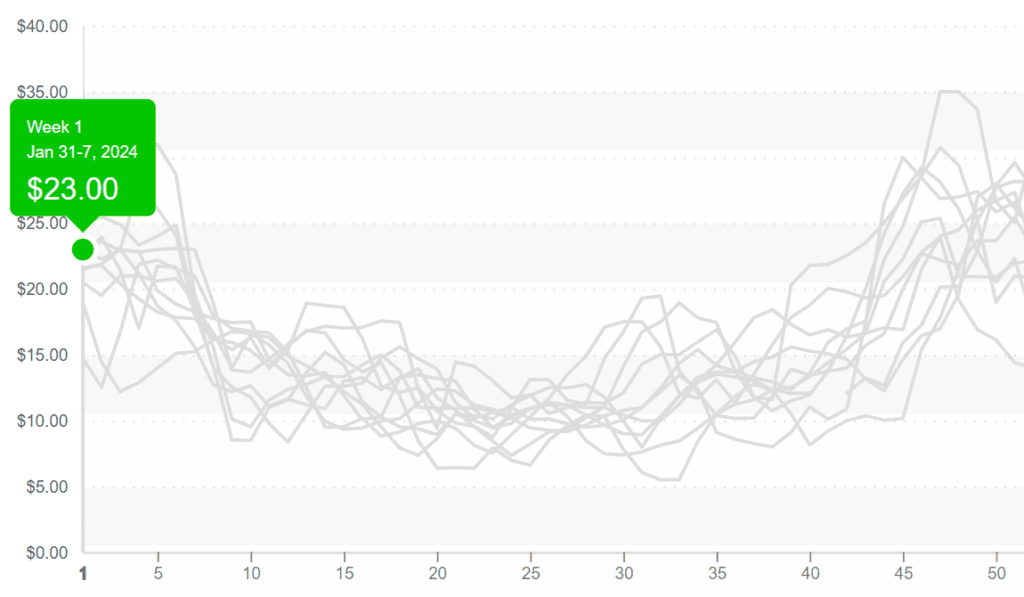
Strawberry prices in the West, $23, are high, typical for week 1.

Now is the time to go on a salad kick. Despite harvesting delays due to morning ice on plants, lettuce markets are basking in below-average pricing.
Butternut squash and other soup-driven commodities have a time to shine during these cold snaps. Good supply and moderate demand are keeping prices sedated. However, more frigid weather is forecasted for mid-week. Ice slows growth and could cause quality issues such as blisters and peeling.
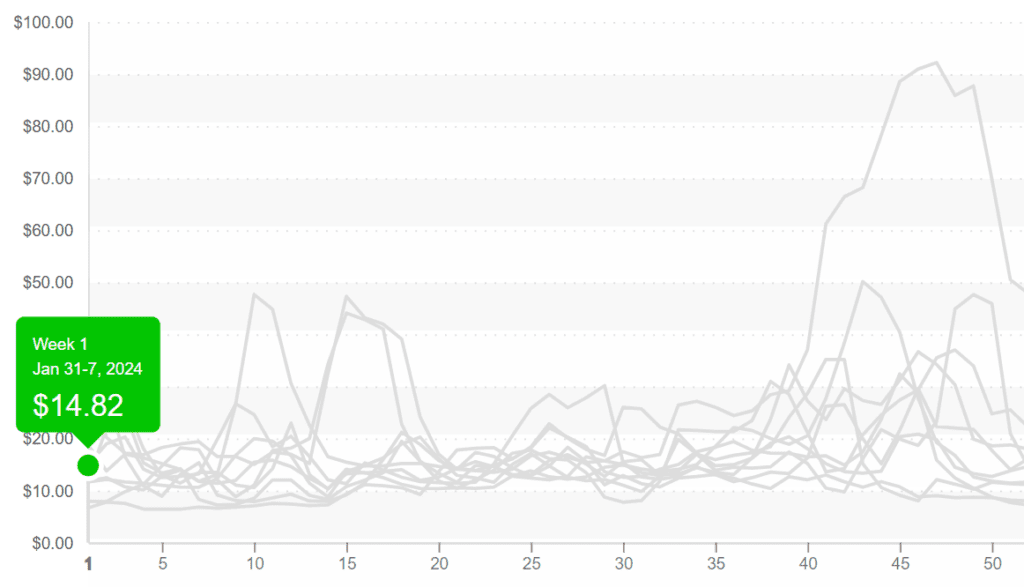
Iceberg lettuce, at $14 for 24ct, is a bargain if you can convince the public to focus on their healthy goals for 2024.

Please visit our website to discover how our online tools can save time and expand your reach. [hyperlink:
ProduceIQ is an online toolset designed to improve the produce trading process for buyers and suppliers. We save you time, increase your profits, expand your network, and provide valuable information.
ProduceIQ Index
The ProduceIQ Index is the fresh produce industry’s only shipping point price index. It represents the industry-wide price per pound at the location of packing for domestic produce and at the port of U.S. entry for imported produce.
ProduceIQ uses 40 top commodities to represent the industry. The Index weights each commodity dynamically, by season, as a function of the weekly 5-year rolling average Sales. Sales are calculated using the USDA’s Agricultural Marketing Service for movement and price data. The Index serves as a fair benchmark for industry price performance.


