It’s Easter week, and produce markets are reacting strongly to the jump in holiday demand and decrease in the supply of heavily weighted commodities like grapes and berries. Overall prices are up +10 percent over the previous week.
OPEC announced surprise production cuts to crude oil beginning in May. In an interview with Reuters, Dan Pickering, co-founder of a Houston-based energy investment firm, said he estimated that production cuts could lift global oil prices by $10 a barrel.
All parts of the produce supply chain, from growers to the consumer, will be negatively impacted by this decision. In particular, the trucking industry, already operating on thin margins due to low market rates, will likely get squeezed further by increasing fuel costs.
This is bad news all around. But don’t worry too much. A lot can happen in three days…
ProduceIQ Index: $1.14/pound, up +9.6 percent over prior week
Week #13, ending March 31st
Blue Book has teamed with ProduceIQ BB #:368175 to bring the ProduceIQ Index to its readers. The index provides a produce industry price benchmark using 40 top commodities to provide data for decision making.
You aren’t mistaken if you are beginning to get the eerie feeling that the U.S. must have more weather-related disasters than most places. The unique but rather ill-fated geography of the continental U.S. predisposes it to some of the deadliest weather events in the world.
As seen over the last few months, catastrophic flooding in the West, freak snowstorms in the Northeast, and now devastating tornadoes in Midwest are just par for the course for domestic contributors to the produce supply chain.
If you haven’t heard about the 50-inch snowpack, stay tuned as it melts over the coming weeks; some areas of California do not have the infrastructure to handle this volume of water.
This week, inclement weather is throwing a wrench in the production of more than a few produce items. Commodities such as raspberries, strawberries, broccoli, and cauliflower are all experiencing significant supply issues due to severe weather.
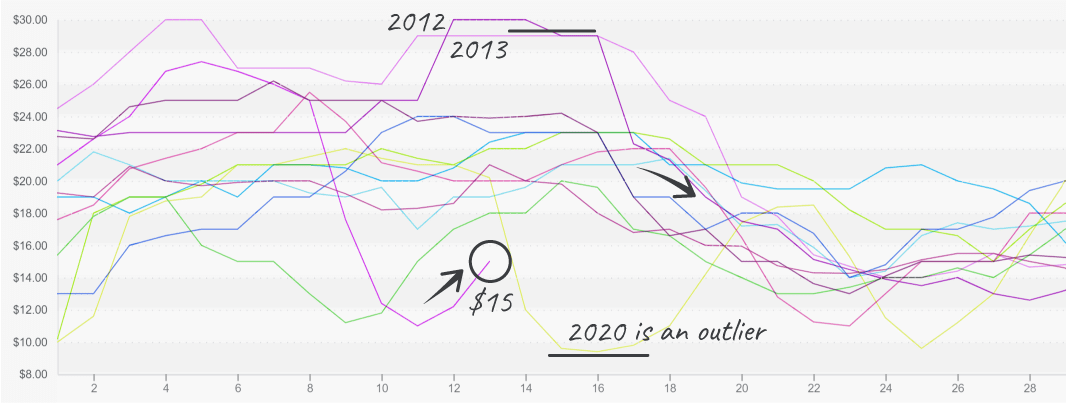
Raspberry prices have risen but are still at a ten-year low. Reported week #13 raspberry volume is significantly behind the historical average. Unseasonably low temperatures in Mexico and California rain are slowing ripening and decreasing yields.
Growers are forecasting a supply gap for the next 2-3 weeks. As a result, prices will likely rise beyond the norm for April. Then, late April/early May will bring much-needed relief from California growers outside Oxnard.
Raspberry prices bounce off their floor, still at a 10-year low.

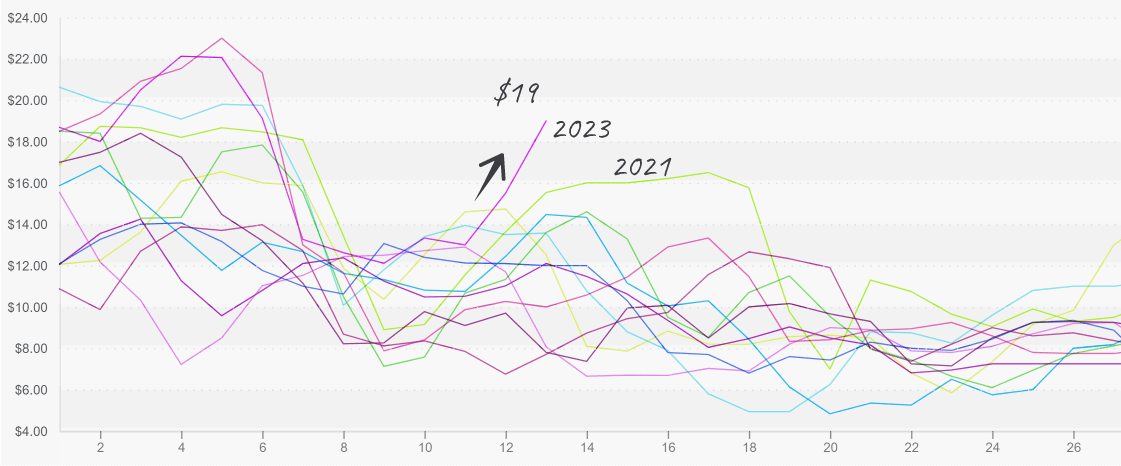
California strawberry growers took a big hit this season. Average prices are up a shocking +22 percent over the previous week due to the end of Florida’s growing season, low volume out of Central Mexico, and flood damage in California.
Strawberry prices, at $19, are forecasted to increase more over the next two weeks. However, hope isn’t too far off. Santa Maria is usually a prolific producer of strawberries in the Spring season. As a result, product from Santa Maria should hit the market in full force sometime in the next 3-4 weeks. When that happens, expect strawberry prices to fall rapidly.
Strawberry prices (Western 8×1 LB clamshells) begin a record-breaking ascent.

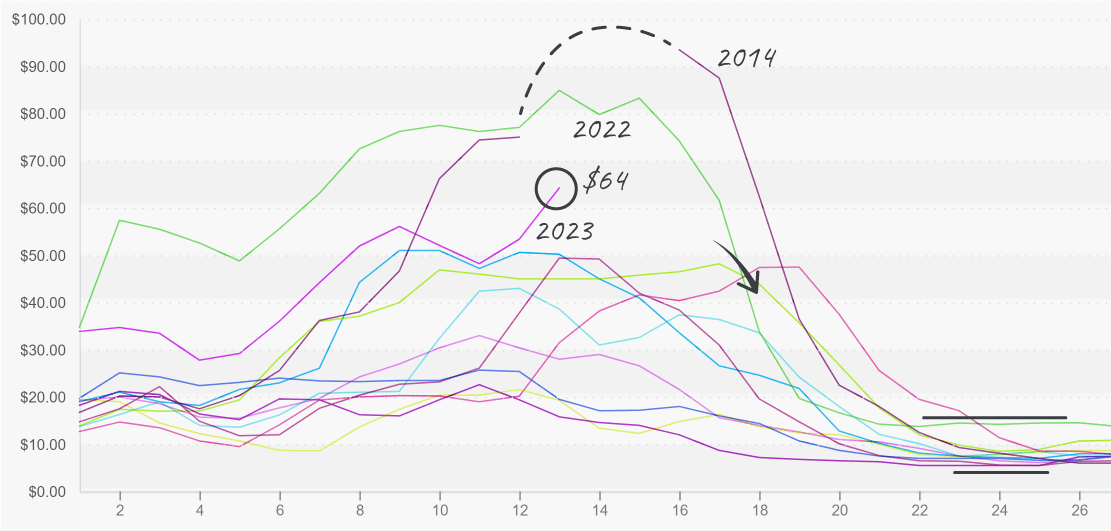
Limes are high, but it could always be worse. At over $80, last year’s week #13 lime prices gave us a bit of perspective on what “high prices” really mean. So, perhaps a $64 per 200ct isn’t so bad?
Holy Week means reduced harvesting in predominately Catholic Mexico. Resultingly, relief for lime markets is most likely two weeks out.
Lime (200ct) prices continue to rise; prices usually start falling in 2 weeks.

Please visit Stores to learn more about our qualified group of suppliers, and our online marketplace, here
ProduceIQ Index
The ProduceIQ Index is the fresh produce industry’s only shipping point price index. It represents the industry-wide price per pound at the location of packing for domestic produce, and at the port of U.S. entry for imported produce.
ProduceIQ uses 40 top commodities to represent the industry. The Index weights each commodity dynamically, by season, as a function of the weekly 5-year rolling average Sales. Sales are calculated using the USDA’s Agricultural Marketing Service for movement and price data. The Index serves as a fair benchmark for industry price performance.


