Hurricane Ian’s official damage reports are rolling in, making real what Eastern tomato markets have known for some time. The citrus and tomato supply will suffer the most due to Ian’s damaging winds and rains. According to preliminary reports, tomato-growing areas impacted by a Category 1 storm will lose 10-25 percent of annual projected production.
On the West Coast, Mexican tomato growers in Sinaloa are receiving heavy winds and rain from hurricane Roslyn. Roslyn landed as a Category 3 hurricane and weakened to a tropical storm as it moved inland to the Northeast, starting south of Mazatlan (which is South of Culiacan). The storm dropped 3-5 inches of rain in/around Sinaloa. Like Ian, it will likely take time until the industry can assess the impact on plants and future harvests.
At $26, round tomato prices (25lb loose 5×6) fall shy of 2021’s ten-year high record. However, prices will likely continue to creep higher due to reduced yields in all growing regions caused by extreme weather events over the last three weeks.
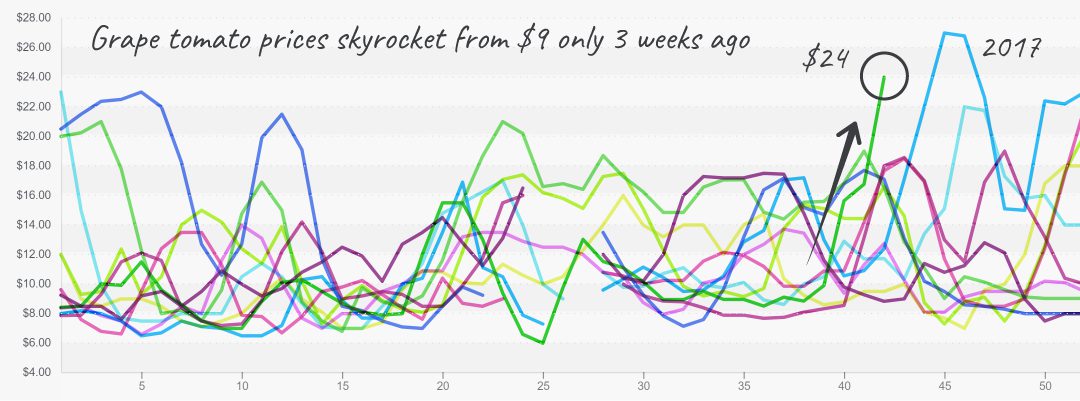
Grape-type tomatoes are up to $38, an astounding +41 percent over the previous week. Prices are unsurprisingly at a ten-year high and will likely stay there until new growers come online in January, especially since grape-type markets rely on growers in Florida and Mexico to meet demand this time of year.
Finally, plum tomatoes are continuing their record-breaking streak this week. For the third week, plum prices are at a ten-year high. Overall markets will tighten throughout the holidays and into January.

Grape tomatoes are in a demand-exceeds-supply situation
Blue Book has teamed with ProduceIQ BB #:368175 to bring the ProduceIQ Index to its readers. The index provides a produce industry price benchmark using 40 top commodities to provide data for decision making.
ProduceIQ Index: $1.08 /pound, Flat over prior week
Week #42, ending October 21st
Last week’s cold front stunted dry-veg supply out of Georgia, including, but not limited to, peppers, cucumbers, squash, and beans.
Bell pepper prices continue fluctuating; green now exceeds $21 for XL. Prices are up +20 percent over the previous week on tired supply and strong demand.
All colors are short on the East Coast. Cold weather is shrinking supply and causing some cold-related quality issues such as shriveling. Western green and red supply is equally as dismal, but volume will improve mid-late November when Coachella and Nogales ramp up production.
Cucumber prices are up +22 percent over the previous week. Right now, Georgia is the primary supplier in the East. Although last week’s cold front undeniably restricted Eastern supply, albeit temporarily, Florida may provide light relief to overextended markets within the next two weeks.
As cucurbits, both cucumbers and squash are unhappy in low temperatures. Western cucumber growers are in a gap, but supply will increase over the next three weeks as Nogales ramps up production.
Eastern squash markets are following a similar trend as other dry-veg commodities grown in Georgia. Prices will likely trend upward for another week while growers in Florida and Mexico ramp up production.
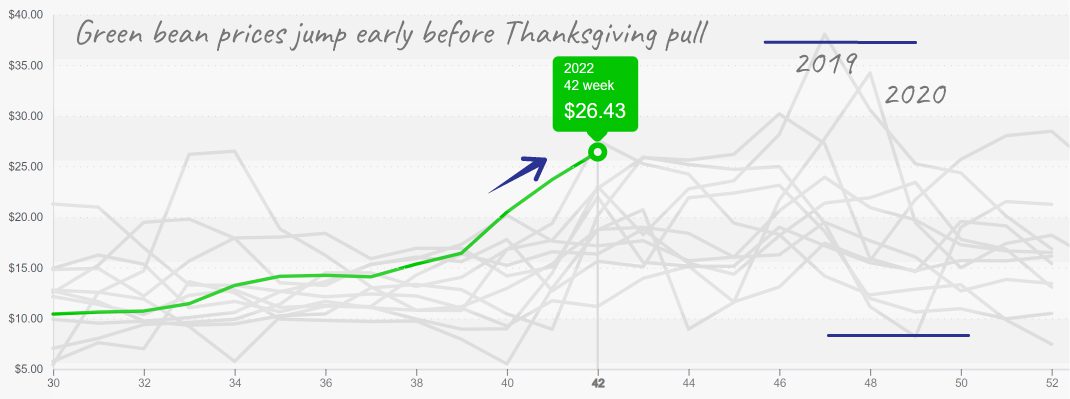
East Coast green beans were devasted by Hurricane Ian, causing Florida/Georgia growers to miss the Thanksgiving pull. Though, Mexico has beans crossing Nogales, which will attract high prices for the holiday.

Green Beans are expected to demand increasing prices for the next two weeks
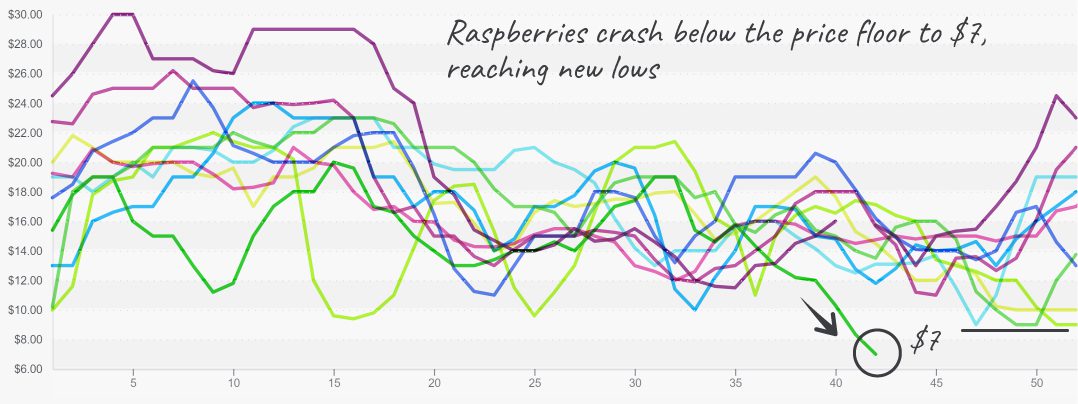
After weeks of unprecedented raspberry prices, the champagne berry’s markets continue to weaken. It seems domestic and foreign growers are endeavoring to regain control of prices by tightening supply; however, there are no guarantees it will be enough to divert the boulder, that is, prices, running ramped down the mountain. So, it’s time to put on your selling shoes and move those berries!

Raspberry prices are sounding the alarm; prevent food waste and move volume
Thanks for reading. Looking forward to seeing you all at IFPA’s show in Orlando!
ProduceIQ Index
The ProduceIQ Index is the fresh produce industry’s only shipping point price index. It represents the industry-wide price per pound at the location of packing for domestic produce, and at the port of U.S. entry for imported produce.
ProduceIQ uses 40 top commodities to represent the industry. The Index weights each commodity dynamically, by season, as a function of the weekly 5-year rolling average Sales. Sales are calculated using the USDA’s Agricultural Marketing Service for movement and price data. The Index serves as a fair benchmark for industry price performance.


