Feel free to add sriracha to the increasing list of food items in short supply. Last week, the internet blew up in response to the news that the beloved Huy Fong Foods condiment would likely run out in the next couple of months due to the lack of the key ingredient: Mexican-grown red hybrid jalapeño peppers.
While the rest of the world may be shocked to hear of a chili pepper shortage, the produce industry has been abuzz with the saucy news for some time. As with other supply-chain disruptions, restaurants are reportedly hoarding sriracha cases to survive the gap.
Blue Book has teamed with ProduceIQ BB #:368175 to bring the ProduceIQ Index to its readers. The index provides a produce industry price benchmark using 40 top commodities to provide data for decision making.
ProduceIQ Index: $1.64 /pound, +0.6 percent over prior week
Week #26, ending July 1
With Cherries leading the way, overall produce markets continue to explode with record-high prices. Even at the FOB shipping point, produce prices this year reflect the same high inflation felt throughout the economy. Most prices rose during the July 4th pull. Only a few commodity prices, such as tomatoes and avocados, declined.
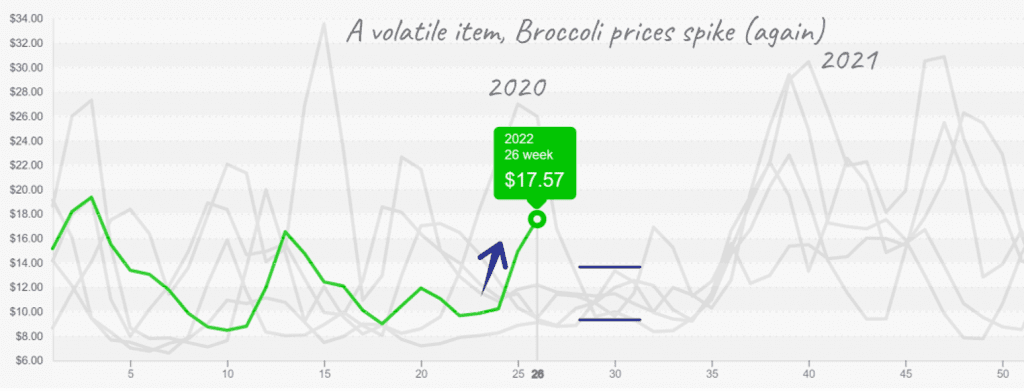
Also in short supply, broccoli prices are up +19 percent over the previous week. Late June’s heat wave in California is lessening available yields and forcing prices to surge higher. Reported volume out of Salinas, CA is significantly down over previous years. Temperatures are forecasted to improve over the next week, though supply and market prices may take more time to stabilize.
Broccoli reaches $17/case and upside exists
Broccoli markets aren’t the only produce commodity unsettled by the recent heat wave. Notoriously heat adverse, iceberg and romaine markets are predictably unsettled; however, prices are seeing comparatively modest increases due to softer demand.
Most Californian lettuce and leaf growers are reporting quality issues like tip burn and discoloration. Prices are on the higher end of the historical price spectrum but are nowhere near the record-breaking territory. As supply recovers, markets are forecasted to remain active for the next two weeks.
Nearing $17, cucumber prices are uncomfortably near 2014’s ten-year record. Western and Eastern cucumber growing regions are in transition. On the East Coast, buyers are waiting for more northern growers to come online. Georgia has finished production, and North Carolina is the primary Eastern harvesting region for the moment. Mexico has limited volume to help cover the gap. Expect markets to remain unsettled until domestic production spreads to more northern states.
Eastern Cucumbers reach high end of historical range for the summer
For your wallet’s sake, we hope you left the blueberry flag cake off your Independence Day celebration menu. Blueberries are in a demand-exceeds-supply situation. The Pacific Northwest and Michigan seasons are still delayed, and Southeastern growers are finished early due to Spring freeze damage. As a result, supply will stay lean until the Pacific Northwest picks up production in two weeks.
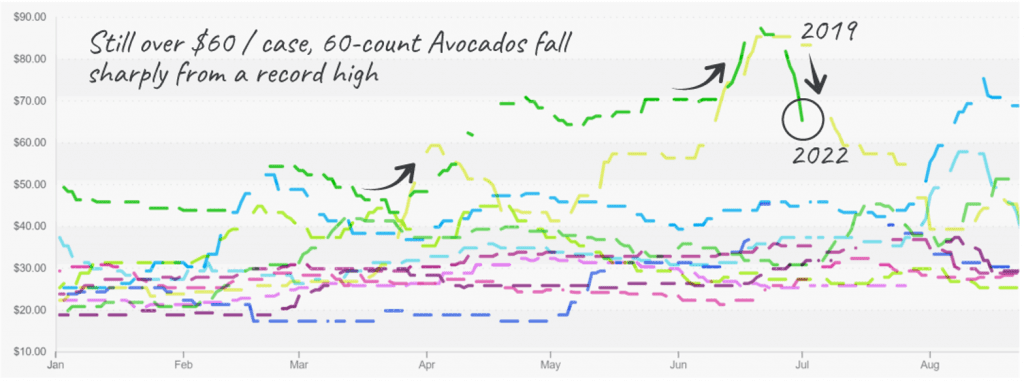
Hass avocado prices are down -15 percent over the previous week. Mexico is still transitioning from the Negra to the Loca crop, but California avocados are at their peak. So it seems that as long as volume out of Mexico continues to increase, prices should continue to de-escalate.
Avocado prices begin a descent, similar to year 2019
An anonymous South Florida restaurant is open for any Sriracha stash-related leads, asking for a friend (mark@produceiq.com).
Please visit Stores to learn more about our qualified group of suppliers, or our online marketplace, here and enjoy free access to our market tools which created the graphs above.
ProduceIQ Index
The ProduceIQ Index is the fresh produce industry’s only shipping point price index. It represents the industry-wide price per pound at the location of packing for domestic produce, and at the port of U.S. entry for imported produce.
ProduceIQ uses 40 top commodities to represent the industry. The Index weights each commodity dynamically, by season, as a function of the weekly 5-year rolling average Sales. Sales are calculated using the USDA’s Agricultural Marketing Service for movement and price data. The Index serves as a fair benchmark for industry price performance.


