Winter Olympians and Ottawa truckers weren’t the only ones shivering in the bitter cold this week. Across the country, temperatures plunged as two massive storms battered much of the U.S.
Overall industry prices are up +3.6 percent over the previous week in anticipation of lower supply from Florida farms.
Kenan and the “Groundhog Snowstorm” came only a few days apart. Kenan brought snow, ice and chilly temperatures to much of the Northeast. Arctic air made it as far as sunny South Florida early in the week, launching produce growers into action.
Later in the week, the Groundhog Snowstorm brought frigid temperatures, a ton of ice and a bit of snow to over 2,000 miles of the continental U.S. It’s estimated over 200,000 homes lost power due to the colossal winter storm, in addition to halting travel across affected states.
Overall fruit and vegetable supply is low in Florida, leading to the current price spike; however, increased demand is necessary to sustain and elevate prices further.
ProduceIQ’s Dry Vegetable category is most affected by the wintry weather. Corn, green beans, eggplant, and squash are all seeing price increases in response to the chilly Florida temperatures.
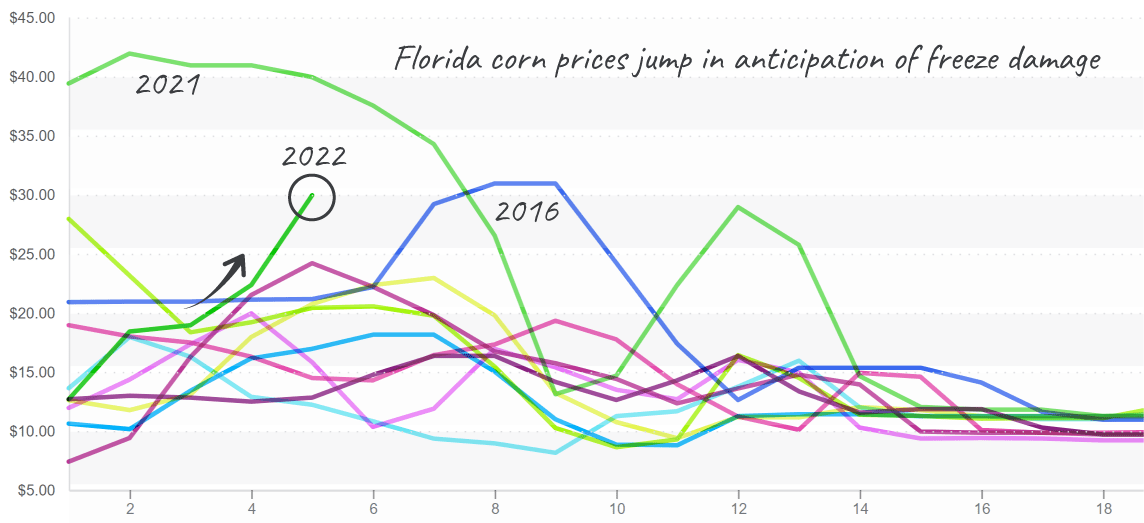
Corn prices, FOB Florida, have increased from $13 to $30 in 4 weeks. Nogales prices only increased from $11 to $17, indicating that either Florida or Nogales is temporarily mispriced. Freight rates don’t explain the price spread. In Florida, sweet corn grown in Belle Glade may have cold-related defects such as husk burn.

Corn prices continue to accelerate as field damage is assessed.
ProduceIQ Index: $1.16/pound, +3.6 percent over prior week
Week #5, ending January 4th
Blue Book has teamed with ProduceIQ BB #:368175 to bring the ProduceIQ Index to its readers. The index provides a produce industry price benchmark using 40 top commodities to provide data for decision making.
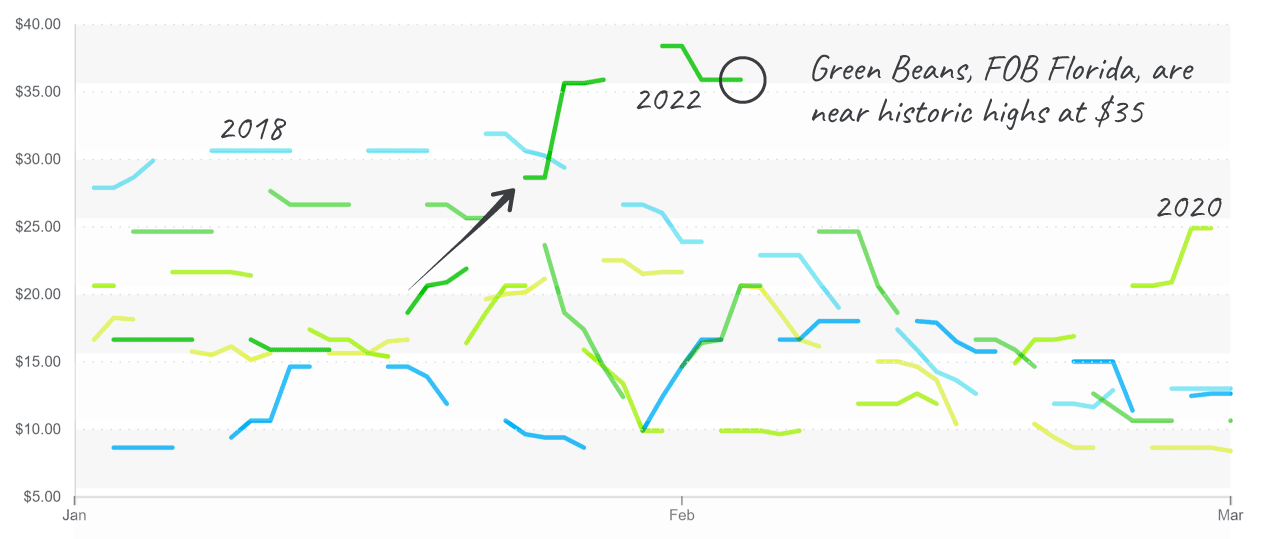
Green bean crops incurred significant damage, and FOB prices are reacting. Florida prices are currently $35 FOB. Several growers prevented even greater devastation by using cover cloth to protect beans from the coldest temps.

Bean prices jump to a new level and are poised to go higher.
Eggplant is also sensitive to the cold and is easily damaged. Brown calyx will be more common from Florida. Prices in Florida reaching $14 and trying to move higher.
Cucumber prices on the East Coast won’t be affected by Florida’s weather because they’re largely imported from Honduras this time of year. Prices are low because of poor demand and high transportation costs. Due to their heavy weight, the cost to haul cucumbers currently exceeds the cost of the produce.
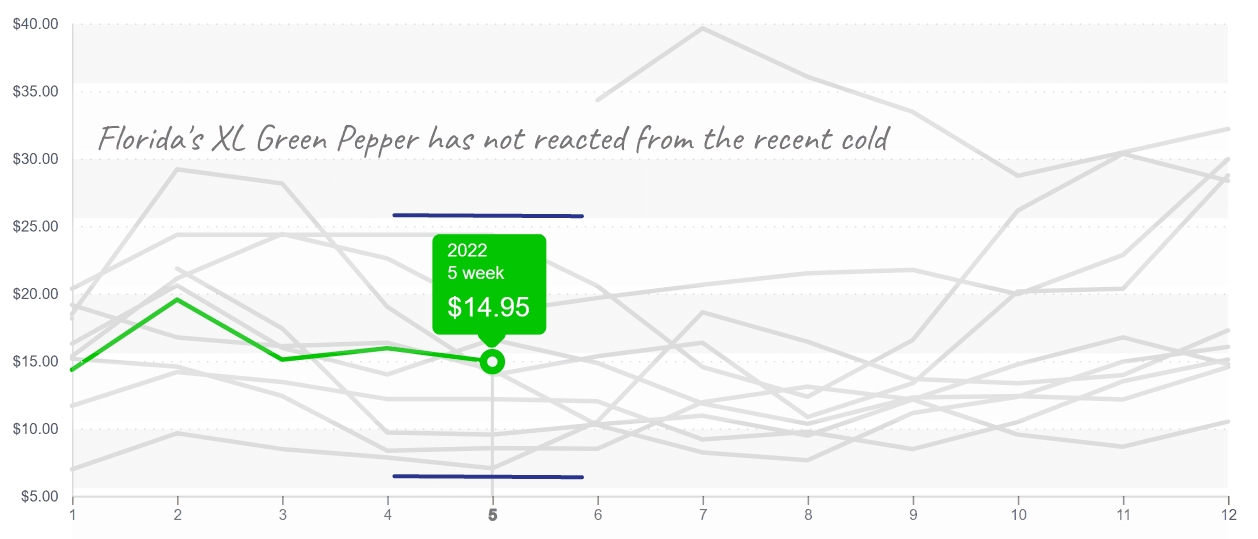
Growers picked green bell pepper in front of the cold snap. But, with plenty of supply, its prices are hovering near production costs. Nogales shippers are trying to use Florida’s weather to get prices into profitable territory. Though some blooms may drop, the warmest farms in Florida escaped damage.

Due to the freight advantage, Florida pepper is trading at $14 FOB vs. $10 FOB Nogales.
Your Valentine’s Day strawberries just got a bit more expensive. Strawberry prices are bounding upwards in response to cooler weather across all growing regions. Strawberry prices typically decrease throughout February and into Spring as multiple growing regions enter peak production periods.
Up +18 percent over the previous week, from $14 to $18, strawberry markets are contradicting characteristic industry price trends. Expect supplies and logistics to be challenged until after the holiday demand wears off.
And for the fourth week in a row, Avocado prices are at a ten-year high. Hass Avocado markets need new supply to thaw the extreme prices. Anticipate prices to stay firm as last-minute orders are placed before the big game on Sunday.
Please visit our online marketplace here and enjoy free access to our market tools which created the graphs above.
ProduceIQ Index
The ProduceIQ Index is the fresh produce industry’s only shipping point price index. It represents the industry-wide price per pound at the location of packing for domestic produce, and at the port of U.S. entry for imported produce.
ProduceIQ uses 40 top commodities to represent the industry. The Index weights each commodity dynamically, by season, as a function of the weekly 5-year rolling average Sales. Sales are calculated using the USDA’s Agricultural Marketing Service for movement and price data. The Index serves as a fair benchmark for industry price performance.


