An analysis of the banana market in 2020 show several volume spikes in the spring as retail adjusted to changing consumer demand early in the pandemic, but both wholesale and retail prices were fairly steady all year long.
Looking specifically at the calm terminal market prices in the first quarter of 2020 gives us some insight of what to expect in 2021, says David Wilson Villasenor, vice president of sales to shippers and growers for Agtools Inc. BB #:355102
Blue Book has teamed with Agtools Inc., the data analytic service for the produce industry, to look how a fruit or vegetable fared in 2020 and what it should expect next year.
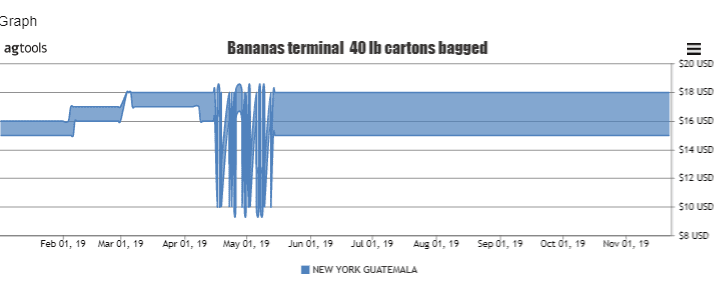
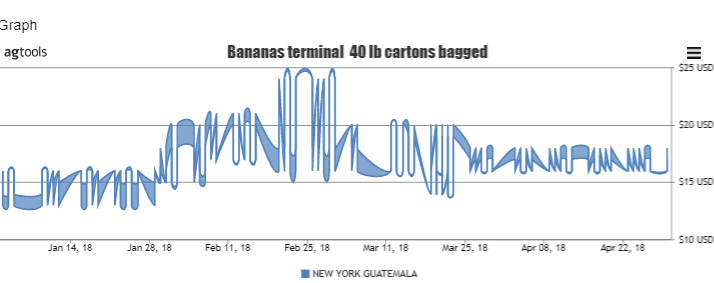
“By looking at the graphs below, prices are increasing year to year from Guatemala to the New York Terminal from May to November, but in 2018 prices were much higher at the beginning of the year January through April,” Wilson says.
Guatemala Bananas New York Terminal Prices 40lb Cartons Bagged Pricing January through November 23rd, 2020
2019
2018
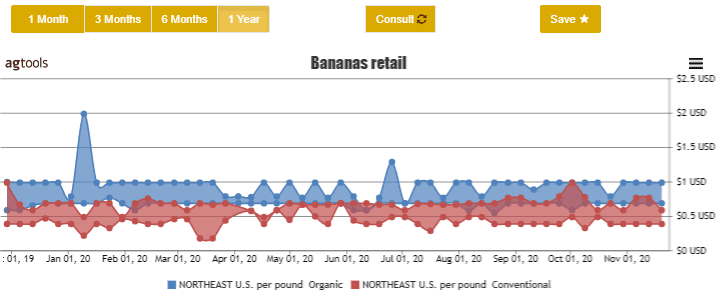
Banana Retail Prices North East USA Region for the last year Organic vs Conventional Type
“We can observe that the Organic prices in blue are about 50 cents higher per pound vs the conventional in red,” Wilson said, but overall, conventional retail banana prices were fairly consistent all year long.
What’s next for 2021?
“Looking at the following graphs for 2018, 2019 and 2020 for the first quarter, January through April pricing in the New York Terminal for 40-pound bagged bananas coming out of Guatemala, it is fair to assume that banana prices will maintain steady between $15 and $25 and with a tendency to increase in 2021,” Wilson said.
Guatemala Bananas New York Terminal Prices 40lb Cartons Bagged Pricing January through April 2020
Guatemala Bananas New York Terminal Prices 40lb Cartons Bagged Pricing January through April 2019
Guatemala Bananas New York Terminal Prices 40lb Cartons Bagged Pricing January through April 2018
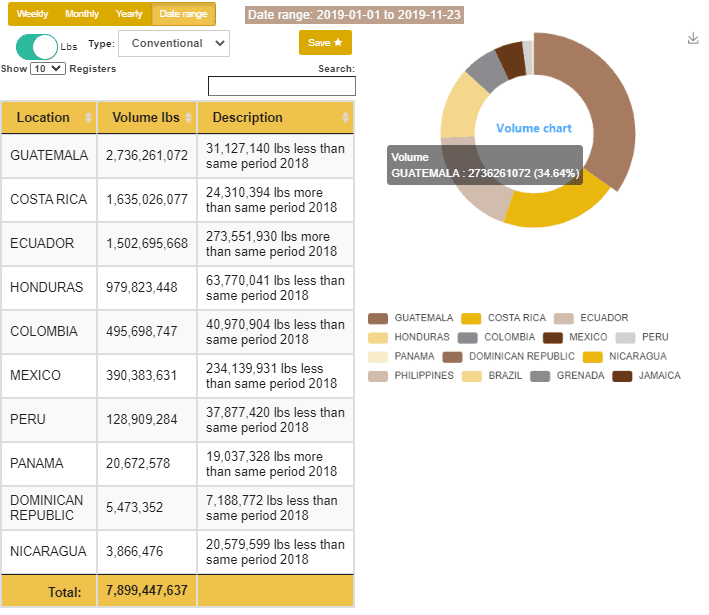
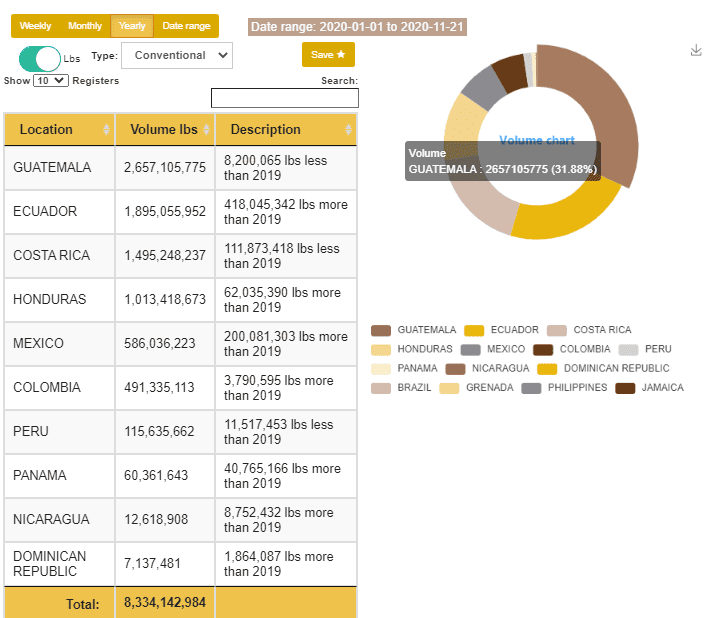
Looking at the graphs below we see Guatemala is the volume leader, although it is losing market share from 34.6 percent in 2019 to 31.9 percent in 2020 for the time period of January 1st through November 23rd.
Banana Volume from January 1st through November 23rd, 2020
“Also note that Ecuador has taken second place from Costa Rica from 2019 to 2020 during the same period,” Wilson says.
Banana Volume from January 1st through November 23rd, 2020
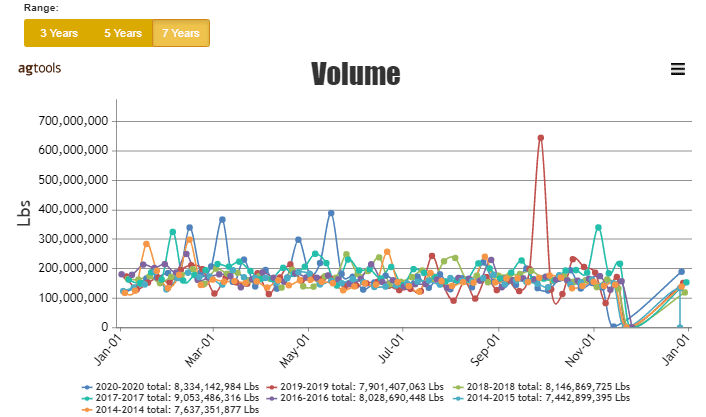
In the graph below we see banana volume comparison in pounds for the last seven years 2014-2020 from January 1st to November 23rd.
“It is interesting to observe that 2020 in blue has volume spikes in February, March, May, and June due to the change in consumer shopping behavior due to the Covid-19 that hit the economy on 2020,” Wilson says.
“Consumers were going less to stores but buying much more volume due to the uncertainty that products could run out,” he says. “Also, there is an unusual spike in September 2019 that may be due the turmoil occurred on August of 2019 regarding the Banana Panama Disease and other diseases.”
Banana 7-year volume comparison January 1st to November 23rd, 2014-2020


