A lighter cherry crop is leading to a stronger market not seen in several seasons.
Through the end of July, the domestic cherry crop is down about 10 percent from last year, and that’s been enough to keep average F.O.B. prices around 50 percent higher than last year, suggesting growers have found a sweet spot in the supply-demand equilibrium.
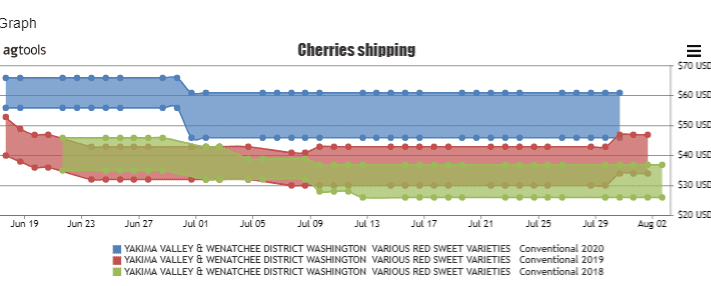
Cherries shipping prices 2018-2020 Size 10 row size
We can see with the graph above the Yakima Valley & Wenatchee District Washington red Sweet varieties size 10 row size. We can observe in the blue 2020 has higher prices $50-60, said David Wilson, vice president of sales for Agtools Inc. BB #:355102
Blue Book has teamed with Agtools Inc., the data analytic service for the produce industry, to look at a handful of crops and how they’re adjusting in the market during the pandemic.
The 2019 trend is in Red with slightly higher prices than 2018.
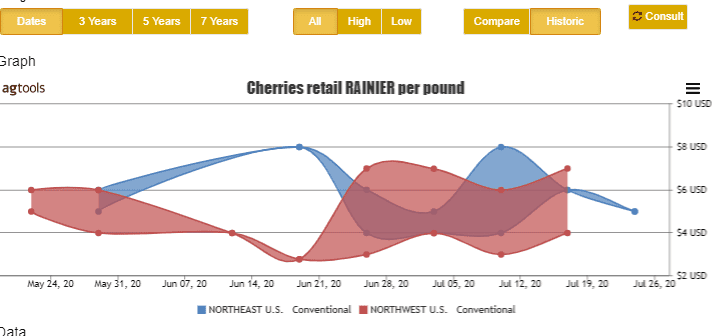
Cherries Retail Price per pound Rainier
We can observe the Rainier Cherries retail prices per pound comparing the Northeast vs the Northwest, Wilson said.
Northeast in blue in 2020 got up to $8 per pound while the Northwest region in Red got to $7 in July. Overall, the Northeast outperformed the Northwest in retail price per pound.
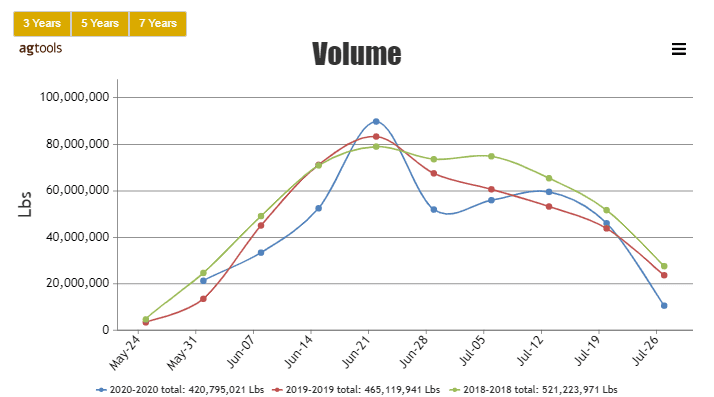
Cherries volume 2018-2020
From the graph above we can see the 3-year comparison for June and July 2018-2020, Wilson said. We can observe 2018 with 521 million pounds 2019 with 465 million pounds and 2020 with 420 million pounds Cherries were down in 2020 8 percent vs. 2018 and 9 percent down vs. 2019 for the 2 -month period June and July.
From the table above we can see from the total volume for Cherries of 524.6 million pounds that Washington enjoys production of 69 percent, California Central 22 percent and Oregon 7.4 percent, Wilson said.
Chile is the foreign country with the most volume with 3 million pounds. Washington is down 18.9 million pounds and California -Central is up 25 million pounds both vs 2019.


