Two months into the COVID-19 pandemic, grocery patterns continue to evolve. Initially, trips were plentiful as consumers sought to stock up their pantries, fridges and freezers and visited multiple stores to find all the items they were looking for. In recent weeks, trips have come down while the average basket size is growing. Meanwhile, online grocery shopping continues to gain in popularity. All these developments have significant impact on fresh produce sales. 210 Analytics, IRI and PMA partnered to understand the effect for produce in dollars and volume throughout the pandemic.
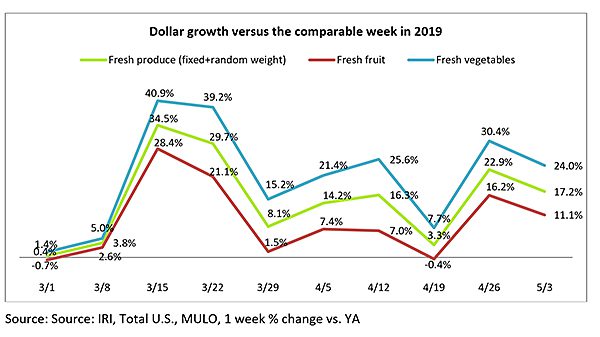
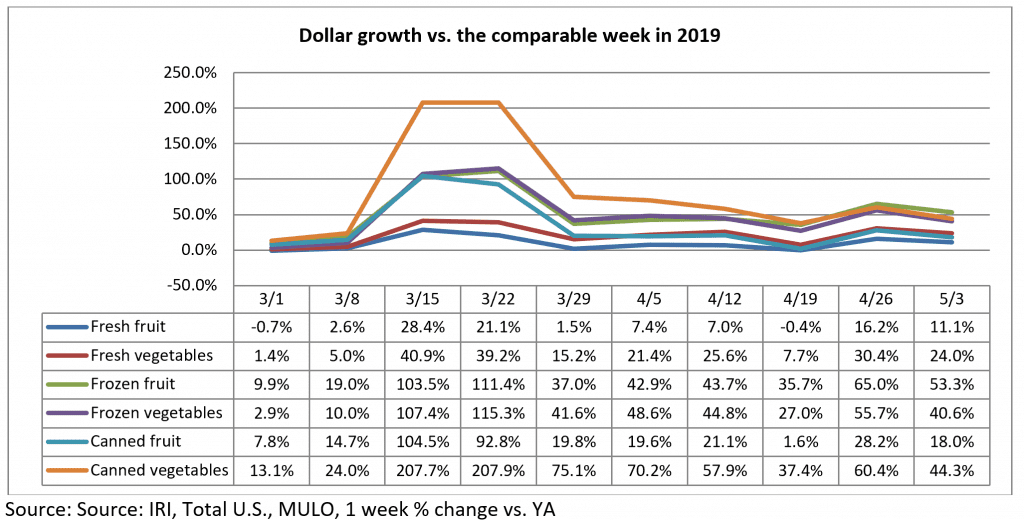
Following a stellar last week of April, fresh produce gains remained highly elevated the first week of May. Fresh produce growth for the week of May 3 versus the comparable week in 2019 increased 17.2%. Fresh vegetables continued to easily outperform fruit, but both achieved double-digit increases. Meanwhile, consumer interest in all three fruit and vegetable offerings continued, with dollars split between fresh, frozen and shelf-stable. Frozen once more had the highest gains, up 43.1%.
- Fresh produce increased 17.2% over the comparable week in 2019.
- Frozen, +43.1%
- Shelf-stable, +32.9%
Source: IRI, Total US, MULO, % growth vs. year ago week ending April 26, 2020
“I am very encouraged with the early May fresh produce performance going into the summer months,” said Joe Watson, VP of Membership and Engagement for the Produce Marketing Association (PMA). “As an industry we are working hard to keep the supply moving, putting employee safety and food safety front and center, and consumers are rewarding our efforts with their dollars. With summer fruit beginning to arrive we should experience a strong bump in fruit demand providing retailers are aggressive with their merchandising strategies into mid and late May. Additionally, foodservice trucks loaded with fresh produce hitting the roads once more was a very welcome sight this week and I am confident we will see strengthened overall produce demand in weeks to come.”
Fresh Produce
Compared with the same week in 2019, fresh produce generated an additional $205 million in sales during the week of May 3. Growth rates were in line with the levels seen during late March and early April. Fresh vegetables, at +24.0%, continued to easily outperform fresh fruit and boasts double-digit increases for seven out of the last eight weeks.
“The changed everyday demand is driving sizeable sales but the where and when is significantly different as well,” said Jonna Parker, Team Lead, Fresh for IRI. “Grocery stores have greatly increased their share of fresh dollars in recent weeks, jumping from 60.2% the week of March 8 to 64.2% the week of April 12, for instance. This is directly related to shoppers wanting to reduce the number of trips. Likewise, after a few years of stagnant engagement, grocery e-commerce jumped years ahead on its growth trajectory. In a way, it is 2025, now.”
IRI data shows that fresh foods have enjoyed double- and triple-digit growth in weekly spending versus year ago since the week of March 8. Since the week of March 15, fresh e-commerce gains versus last year did not drop below +68% and peaked as high as +105%.
Parker added, “The gains in fresh foods e-commerce are accelerating, driven by two factors. First, many retailers and third-party grocery delivery companies had to very quickly ramp up their online capacity, which resulted in great pressure on slot availability early on during the pandemic. Second, there are many shoppers who ordered online for the first time as a result of the pandemic. They may have started off with smaller baskets and avoided fresh. But as their comfort with online ordering grows, it is very likely we will see order frequency, basket size and inclusion of fresh items, grow along with it.”
Several shoppers commented on stores still getting adjusted to changed traffic patterns and produce out-of-stocks on the Retail Feedback Group’s Constant Customer Feedback (CCF) program this week.
One shopper wrote, “I have always liked this store location because they always seem to have fresh produce, and a large variety of meats, etc. Now when you go in, you have to take what is left it seems. I work and do not get there until in the afternoon and cannot go in the mornings. Very frustrating to not find things that I get all the time because people are so busy hoarding.”
Other shoppers commented on produce as part of their online order on CCF, “This was very convenient in this time of crisis with COVID-19. I did not mind that the pickup day were a week out as the website tells you up front before ordering. My personal shopper did an excellent job of picking the items! And although I was skeptical at first to order produce online with not being the one to choose, I was more than pleased with my personal shopper’s selections. Thank you!”
Fresh versus frozen and shelf-stable
Percentage-wise, gains in fresh produce are bound to be lower than frozen and shelf-stable due to its share of total produce. The shares across fresh, frozen and canned during the first week of May were unchanged versus the prior week. The majority sales share, 79%, is generated by fresh, but both canned and frozen remained elevated versus 2019 levels.
An early April consumer survey by the American Frozen Food Institute (AFFI) and 210 Analytics found that 15% of frozen food shoppers pointed to their concerns over buying fresh fruit and vegetables during COVID-19 as a reason to purchase frozen fruits and vegetables. Consumer comments illustrate this as well.
One shopper said, “The idea that I do not know who has touched the fruit, or worse, coughed on it, has me avoiding the fresh produce department right now.”
Parker commented, “The needs of the fruit and vegetable-buying consumers are being met throughout the store right now.”
IRI data demonstrates that new buyers drove a significant share of dollars for both canned and frozen fruits and vegetables. For instance, 48% of shoppers who bought canned fruits in recent weeks had not bought the category in the same four weeks last year. In frozen, 32% of those who bought frozen fruit did not do so the same four weeks in 2019 and yet they represented 62% of frozen fruit dollars. Vegetable numbers are similar. For instance, 46% of frozen vegetable sales during COVID-19 came from buyers who did not buy frozen vegetables during the same period last year.
Closely related are indicators of consumers increasingly moving to pre-packaged items.
“In recent years, the packaging debate was dominated by sustainability,” said Watson. “Now, consumers are much more cognizant of the food safety function of packaging. This could result in sustainability taking a back seat to food safety in the consumer needs hierarchy in the foreseeable future.”
IRI data shows a small shift in the share of produce that is fixed weight, and thus packaged, from 47.1% during the 52 weeks ending late January versus 51.2% of sales during the pandemic.
“We have to be a little cautious to draw big conclusions from this,” said Watson. “On the one hand, some retailers are creating grab-and-go produce bags in-store, that would still ring up as random weight. On the other, there is the chicken and egg discussion. Is the share of packaged up because of what items people gravitated towards during the pandemic, or, did they buy those items because they were bagged? For instance, big pandemic winners have been berries, potatoes, onions and oranges that all tend to have a high likelihood of being packaged. It is best to rely on your in-store observations and listen to the consumer to understand their packaging wants.”
Dollars versus Volume
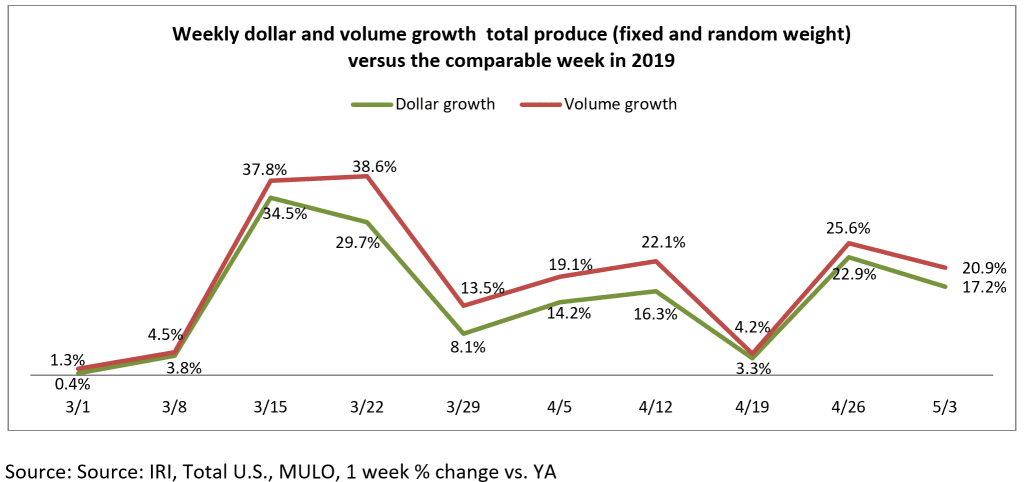
The volume/dollar gap widened the week of May 3 to 3.7 percentage points, up from 2.7 points. However, this is much diminished from the week ending April 22, when the volume/dollar gap was 8.9 percentage points.
Both vegetables and fruit saw volume tracking ahead of dollars the week of May 3 versus the comparable week in 2019.
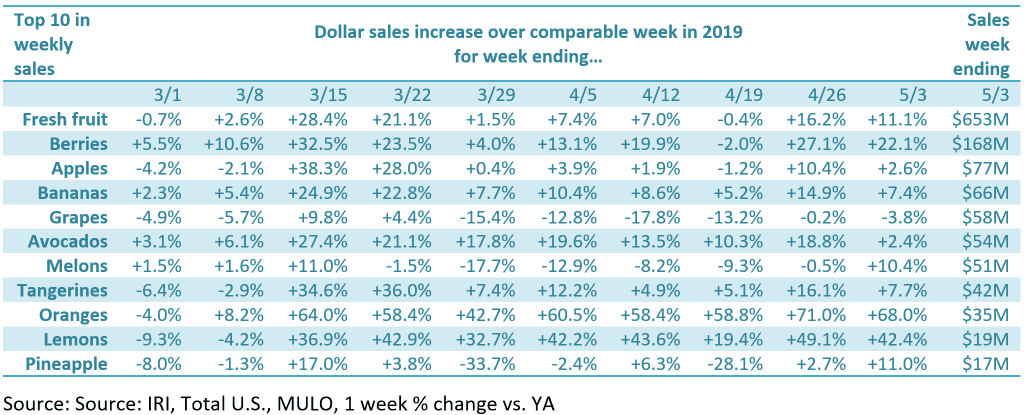
The top three growth items in terms of absolute dollar gains over the same week in 2019 were berries (+$30 million), potatoes (+$23 million) and lettuce, +$18 million. However, at the category level, big differences continued to exist between dollars and volume, driven by deflationary pressure. Within the top 10 growth items in absolute dollars, significant volume/dollar gaps remain for items, such as peppers, onions and melons.
“On the fruit side, we saw significant difference in dollar growth versus volume growth for items such as pineapples (30 percentage point gap), avocados (18 points) and melons (11 points) this week,” said Watson. “By and large, these gaps are driven by deflationary pressure on the price per volume. Thinking about entering watermelon season, it is great to see strong demand, up nearly 22% over last year, but the price per volume being down nearly 10% over last year is affecting dollar gains.”
On the vegetable side, onions had a strong 28.9% boost in dollars, but volume sales were up 40.6%, with the retail price per volume down more than 8%. Others with high dollar/volume gaps were celery (30 percentage points), peppers (18 points) and Brussels sprouts (15 points). On the other hand, we saw some upward pressure as well for other items, particularly potatoes, with dollar sales still going strong, at +47.1%, and volume up 34.1%. Average price paid (dollars divided by volume) for potatoes was 9.7% higher versus the same week last year.
Fresh Fruit
“Immunity boosting powerhouses, such as oranges, berries and lemons, have been driving recent sales growth trends. These are also versatile around the house- from smoothies, to salads and, in lemons’ case, cooking,” said Parker. The top 10 items in terms of dollar sales saw double-digit increases for six during the week of May 5 versus the comparable week in 2019.
Fresh vegetables
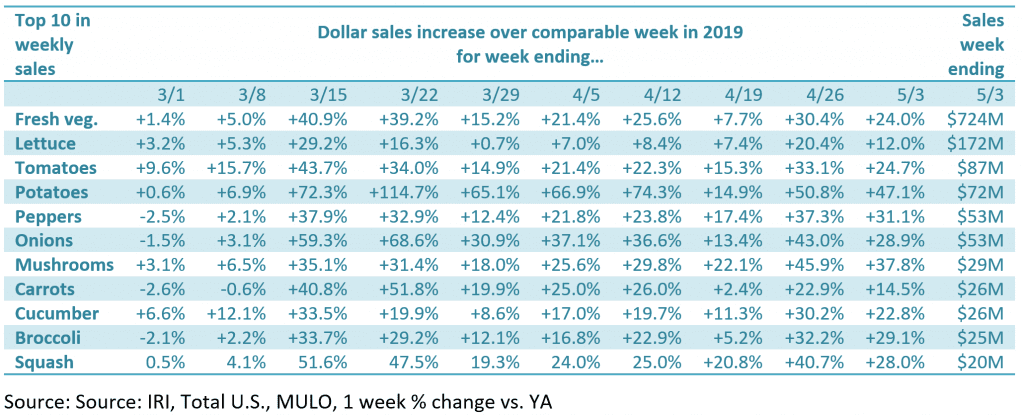
All top 10 vegetable items in terms of dollar sales gained double-digits the week ending May 3, with increases ranging from +12.0% for lettuce to +47.1% for potatoes.
“This is elevated everyday demand at work,” said Parker. “Excellent and prolonged gains in items like lettuce, potatoes, peppers and onions can only mean one thing: America is cooking. And that will have positive impacts for a long time to come.”
Lettuce was the top sales category, but potatoes were the top contributor in absolute dollar growth in vegetables, adding $23 million in sales versus the comparable week in 2019.
Watson added, “The summer vegetable season is upon us and while not a top 10 item in sales, I always found sweet corn to be a good indicator of summer demand. I’m encouraged to see corn dollar sales gains rising each week to reach +26.8% the week of May 3, though dollars are tracking well ahead of volume that was up 18.5%. We have to be cognizant of the different nature of gatherings, but corn remains a great summer cookout opportunity.”
Packaged Salads
Packaged salad sales did well with gains just below 10% over last year.
Fresh Versus Frozen and Shelf-Stable Fruits and Vegetables
Consumers continued to split their fruit and vegetable dollars three ways during the week of May 6. In addition to the strong performance of fresh vegetables, frozen and canned vegetables had ongoing strong growth during the first week of May as well. This was the third week where frozen fruit sales outpaced gains in frozen vegetables since the week of March 15.
Perimeter performance
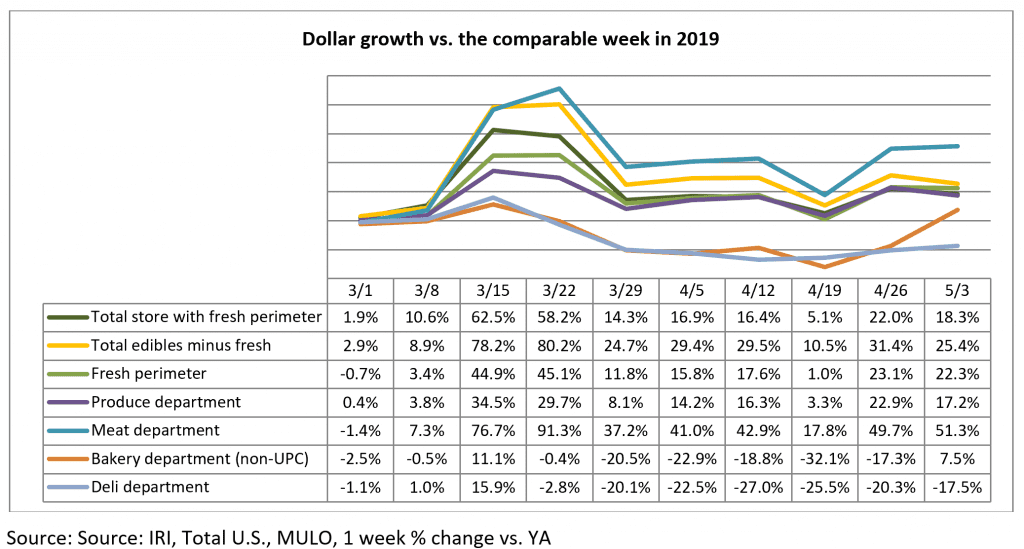
The week of May 3 was not as strong as the prior week, but food sales remained highly elevated versus year ago. Edibles excluding fresh were up 25.4% and the total fresh perimeter was up 22.3% — much in line with total produce growth. Meat, once more, was the star of the perimeter, while sales in deli departments continued to struggle.
What’s next?
Prompted by the continued media coverage of meat shortages and rising prices, the run on meat continued the second week of May. This will likely prompt complementary trips to the produce department. Additionally, Mother’s Day may have provided another small sales boost with restaurants in most states still closed or open with limited seating capacity. For the foreseeable future, it is likely that grocery retailing, including produce, will continue to capture an above-average share of the food dollar.
Please recognize the continued dedication of the entire grocery and produce supply chains, from farm to retailer, on keeping the produce supply flowing during these unprecedented times. #produce #joyoffresh #SupermarketSuperHeroes. 210 Analytics and IRI will continue to provide weekly updates as sales trends develop, made possible by PMA. We encourage you to contact Joe Watson, PMA’s Vice President of Membership and Engagement, at jwatson@pma.com with any questions or concerns.


