Romaine prices have struggled this year, particularly after mid-March stay-at-home orders closed restaurant dining rooms.
Volume since early March has been below average, but it still reflects pre-pandemic plantings.
As the crop moves to the Salinas, Santa Maria and Oxnard areas of California, supplies should be strong until about mid-June, and then plantings could be down as much as 25 percent because of the lower demand from the foodservice channel.
2020 CONVENTIONAL ROMAINE VOLUME
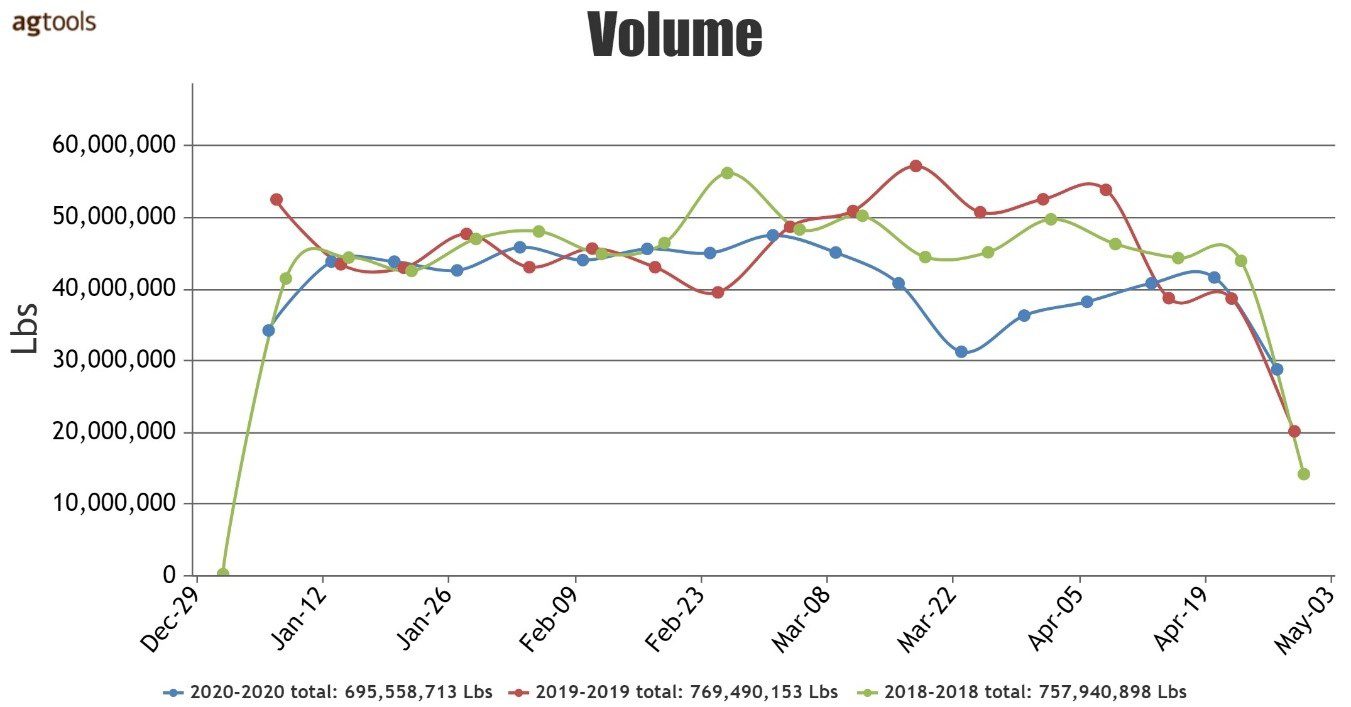
Total industry volume for conventional Romaine Lettuce is experiencing a decrease compared to the past two years for the same first four months of the year, said Raúl López, an agronomist at Agtools.
Blue Book has teamed with Agtools Inc., the data analytic service for the produce industry, to look at a handful of crops and how they’re adjusting in the market during the pandemic.
In spite of the end-of-year scare due to the E.coli breakout in the Salinas Valley, Romaine began the year with similar volume vs. 2018 and 2019, Lopez said.
In February volume began a downward trend that in March reflected considerably less volume than the past two years. By mid-March, largely influenced by the pandemic, there was a steep decrease in volume. April showed improved volume but the 3rd week of the month volume again decreased in a similar manner to 2018 and 2019.
F.O.B. PRICE FOR CONVENTIONAL ROMAINE LETTUCE FROM WESTERN ARIZONA
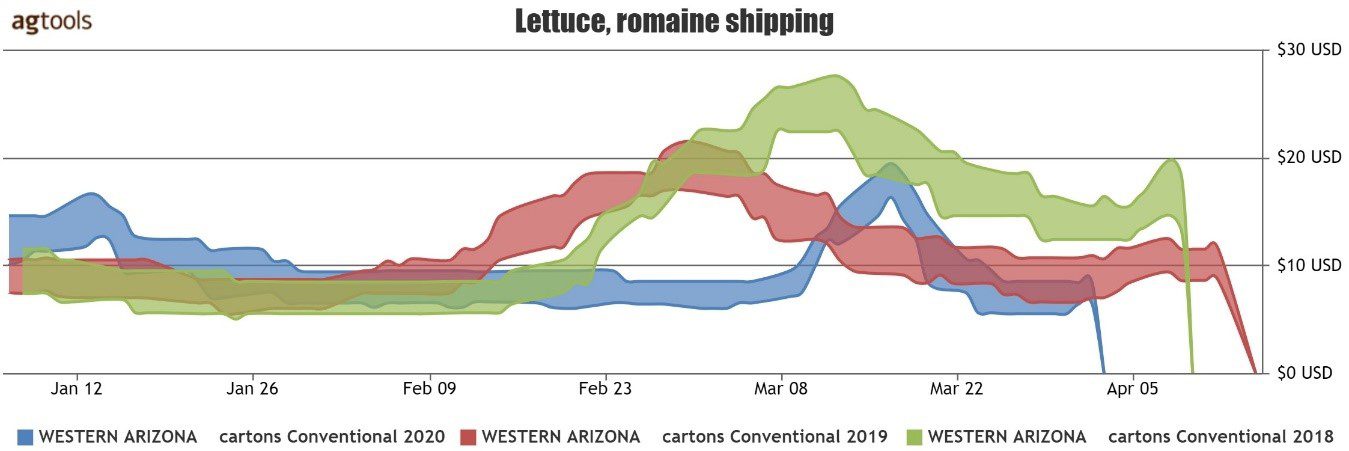
January 2020 FOB pricing for Western Arizona started out slightly higher than both 2018 and 2019, but it quickly settled into a similar trend to previous years, Lopez said. However pricing did not see the increase experienced in past years during February but rather remained well below 2018 and 2019 until a slight peak in mid-March, where it reached a higher FOB than 2019, but still below 2018.
LOS ANGELES TERMINAL MARKET PRICE FOR WESTERN ARIZONA ROMAINE LETTUCE
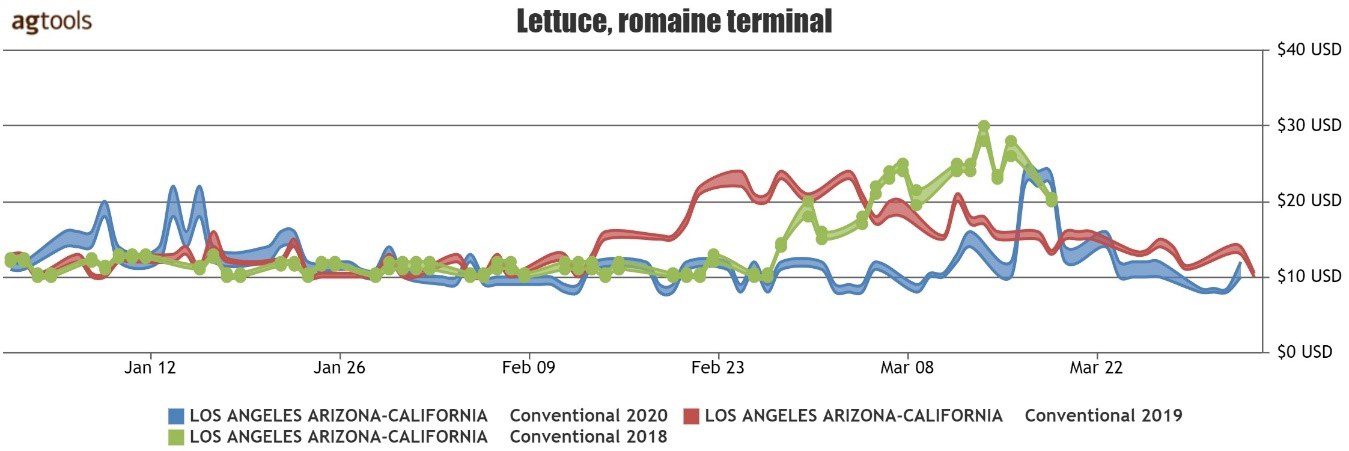
Los Angeles terminal market prices came out of the gate strong this year, but by mid-January pricing had stabilized to 2019 and 2018 levels, Lopez said. By the end of February, prices were substantially lower than the past two years, particularly 2018 where pricing had reached the high $20s. While there was a peak during the “crisis shopping spree” in mid-March the prices quickly decreased until the end of season.
VOLUME CHART FOR MAIN REGIONS OF ROMAINE LETTUCE(CONVENTIONAL)
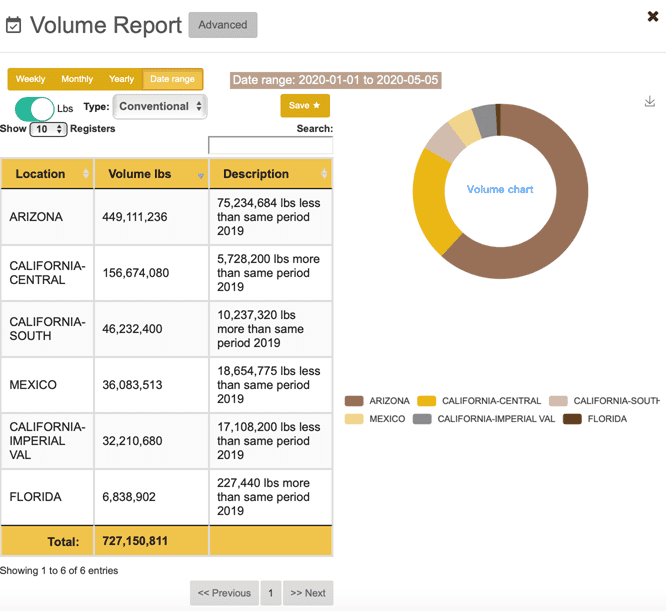
Two main regions represent 99 percent of the total volume. These regions are Arizona (65 percent) and California (34 percent) from January thru April.
Arizona experienced over 75 million pounds less than 2019. While California saw an increase in Central and Southern region volume, it experienced less volume in Imperial Valley vs. 2019. Overall volume showed a decrease of just over 1 million pounds for this timeframe vs. last year.


