Welcome to Blue Book!
Are you ready to join the thousands of companies who rely on Blue Book to drive smarter decisions? View our plans and get started today!
Still have questions? We’d love to show you what Blue Book can do for you. Drop us a line– we’ve been waiting for you.

Trade with confidence... every time.
Blue Book’s real-time alerts help you stay up to speed with everything in the produce industry

Trade with confidence... every time.
Blue Book’s real-time alerts help you stay up to speed with everything in the produce industry

Trade with confidence... every time.
Blue Book’s real-time alerts help you stay up to speed with everything in the produce industry

Trade with confidence... every time.
Blue Book’s real-time alerts help you stay up to speed with everything in the produce industry

Trade with confidence... every time.
Blue Book’s real-time alerts help you stay up to speed with everything in the produce industry

Trade with confidence... every time.
Blue Book’s real-time alerts help you stay up to speed with everything in the produce industry

Trade with confidence... every time.
Blue Book’s real-time alerts help you stay up to speed with everything in the produce industry
Credit & Finance: Industry Performance
Blue Book Ratings and Scores are based on cumulative reported trade experiences on a subject business by its trading partners and industry relationships. Survey and accounts receivable aging...
Blue Book Ratings and Scores are based on cumulative reported trade experiences on a subject business by its trading partners and industry relationships. Survey and accounts receivable aging data are key attributes for both the Rating and Score.
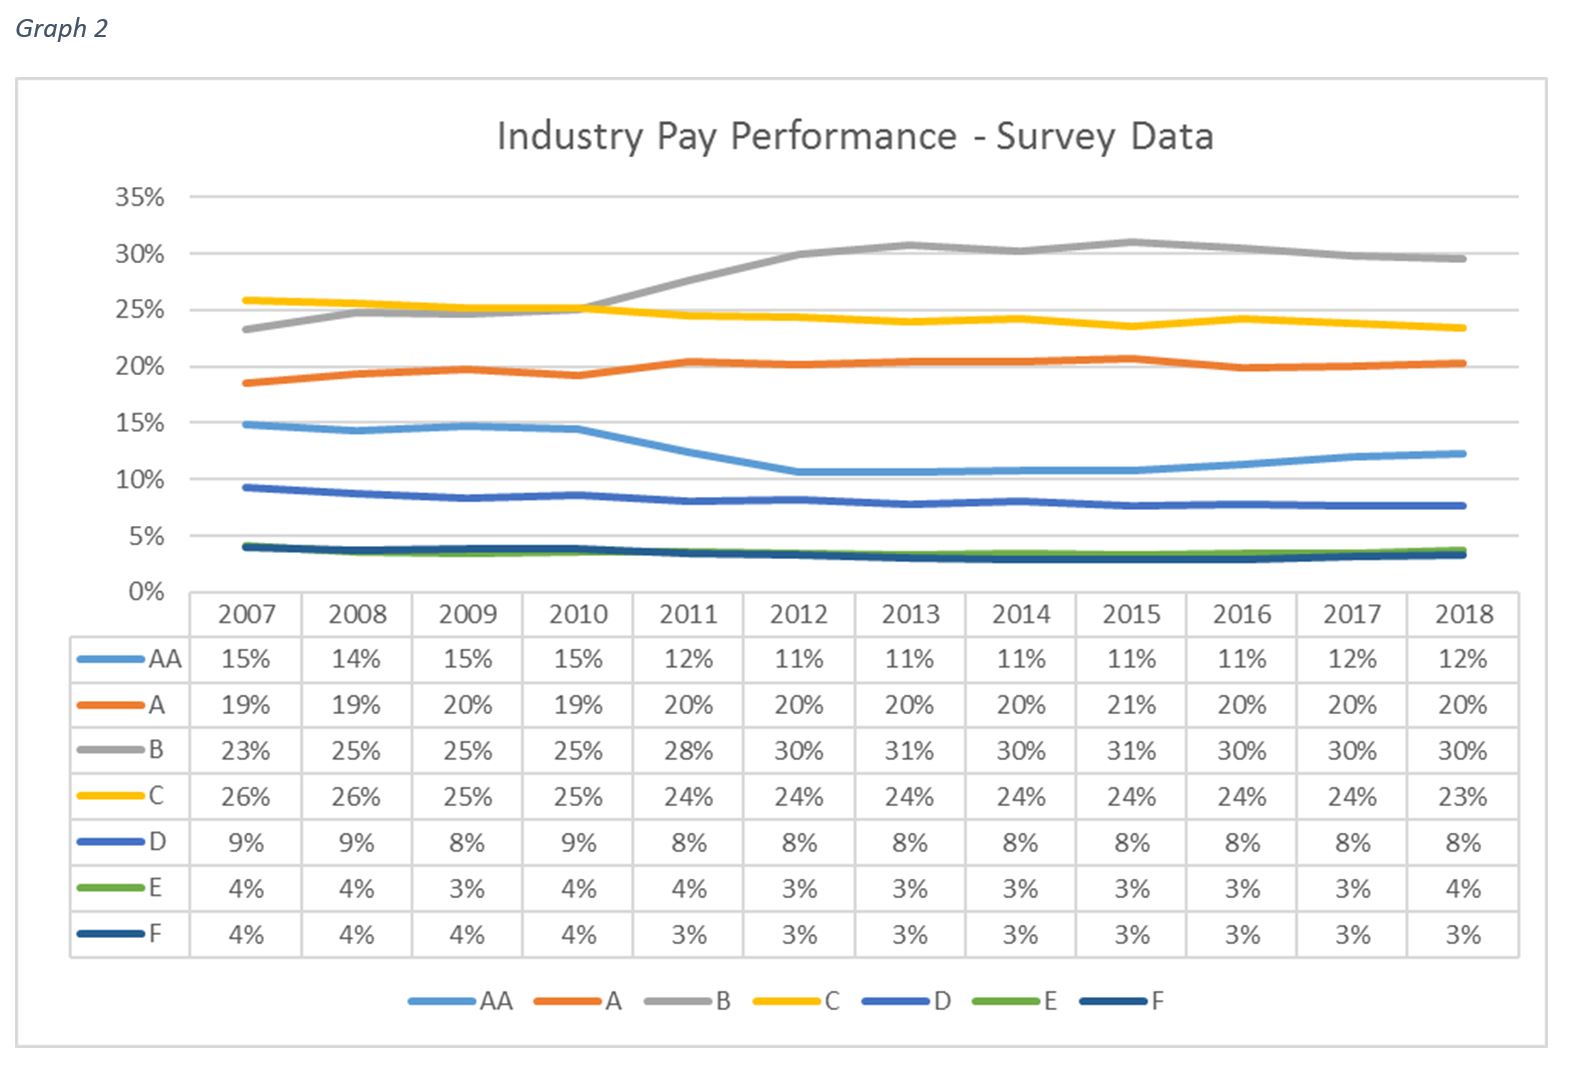
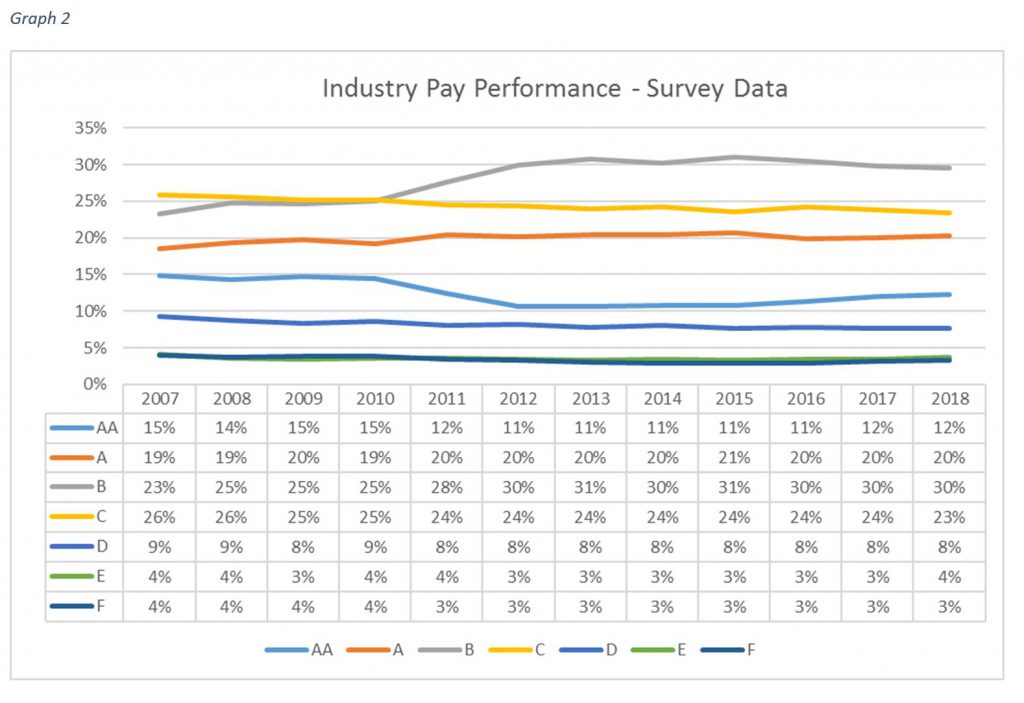
The Industry Pay Performance graph (Graph 2) depicts pay performance frequency as reported through Blue Book’s investigation survey methodology.
Pay descriptions are broken into seven distinct categories: AA (1-14 days), A (15-21 days), B (22 to 28 days), C (29 to 35 days), D (36 to 44 days), E (45 to 60 days), and F (61-plus days); are defined as ‘date of invoice – receipt of payment’ and carry their own specific data ranges as specified above.
Year-to-year change is rather minimal for each pay category. The central tendency for payments is to be received in 22 to 28 days (B). Noticeable changes over the period are in the AA, B, and C categories with AA declining from 15 to 12 percent, C declining from 26 to 23 percent, and the largest mover, B increasing from 23 to 30 percent.
Pay reported beyond 35 days, either D, E, or F pay reports, may be reflective of slow performance, disputed files, or price after sale dealings. Industry performance consistency is noteworthy—general assumptions reflect that significant underperformers go out of business rather than erode overall industry averages, and as a whole, industry ratings and score performance is good.
This is an excerpt from the most recent Produce Blueprints quarterly journal. Click here to read the full article.
Bill Zentner is Vice President, Ratings Service for Blue Book
News you need.
Join Blue Book today!
Get access to all the news and analysis you need to make the right decision --- delivered to your inbox.
What to read next
Bagged avocado sales surge in Q4 2024
Hass Avocado Board: Bagged avocados played a key role in boosting retail sales of Hass avocados during the 2024 holiday season.
Tomato prices falling as supplies increase
Markon Cooperative reports that tomato supplies are increasing as new crop production is underway in Culiacan, Mexico.
Procurant releases tariff charge management for retail buyers
Procurant announced a new capability for managing tariff-related charges within its Procurant Commerce platform.
The Wonderful Company honored on Fortune’s 100 Best Companies to Work For List
The Wonderful Company has again been named one of Fortune magazine’s 100 Best Companies to Work For, moving up from last year.
Rabobank report analyzes tariff effects on vegetable market
Rabobank released an April 1, 2025, report, U.S. vegetable trade amid tariff and trade tensions authored by David Magaña.
Ocean Mist Farms starts spring artichoke season
Ocean Mist Farms, North America's leading grower and shipper of fresh artichokes, has officially kicked off their spring season.
Subscribe to our newsletter
© 2025 Blue Book Services. All Rights Reserved

