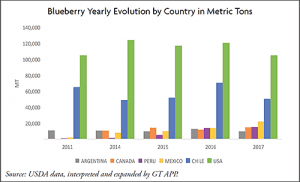
Average annual blueberry production, in tons, has continued to climb for both domestic and global producers.
Total market supply has increased 14 percent from 2011 to 2017 with U.S. total production representing 216,266 metric tons for 2017. Participating countries have upped their game in recent years with Canada, Mexico, and Peru experiencing the highest growth rates in this very profitable sector.

From 2011 to 2013, the top three producers for the U.S. market were the United States itself, producing 55 percent of the supply or 104,537 metric tons in 2011, followed by Chile at 33 percent and 64,723 metric tons, and Argentina at 4 percent of the market with 10,880 metric tons.
In 2014 Canada’s blueberry supply surpassed Argentina’s imports; the same year, Chile’s shipments fell to 24 percent, down from 33 percent in 2011. At the same time, the United States increased its market participation from 55 to 61 percent, with robust domestic harvests and the dropoff in Chilean production.
In 2016 Mexico expanded its market penetration to become the third most important supplier, sending 13,938 metric tons to the United States, but representing only 5 percent of the overall market.
For 2017 the top suppliers were the United States with 104,709 metric tons and a market share of 48 percent, and Chile, representing 23 percent, though its production contracted from 70,254 metric tons the previous year to 50,090 metric tons.
Mexico posted significant gains for 2017 with production rising 56 percent and exports hitting 21,883 metric tons for the year, representing an annual average growth rate of 50 percent since 2011. Although Mexico ships almost all year, its peak shipping months are from March to May.
These months have shown extraordinary growth: up 77 percent from the 2015-16 season to 2016-17. In the first months of 2018, Mexico’s output rose 42 percent from 2017 and this surge is expected to continue.
Another emerging player, Peru, competes with Argentina from October to November and Chile in December and January. Initially, Peru began with very low participation and market share in 2011 but began gaining traction in 2012, then experienced skyrocketing growth by the 2015-16 season, up 67 percent.
Peru exports surpassed Argentina in the 2015-16 season by 10 percent, at a time when Argentina claimed a 15 percent share of the export market (which has now fallen to 9 percent). More astonishing is Peru’s 2017 output—up 54 percent from 2016’s stellar numbers.
Peru now ships 17 percent more blueberries than Canada to the United States in a year. Canada, which competes with the U.S.’s domestic demand, had reduced supply for the 2016 season (17 percent), but returned with a 26 percent increase in 2017 at 14,746 metric tons, representing 12 percent of the 2017-18 U.S.’s import market.
Average annual blueberry production, in tons, has continued to climb for both domestic and global producers.
Total market supply has increased 14 percent from 2011 to 2017 with U.S. total production representing 216,266 metric tons for 2017. Participating countries have upped their game in recent years with Canada, Mexico, and Peru experiencing the highest growth rates in this very profitable sector.

From 2011 to 2013, the top three producers for the U.S. market were the United States itself, producing 55 percent of the supply or 104,537 metric tons in 2011, followed by Chile at 33 percent and 64,723 metric tons, and Argentina at 4 percent of the market with 10,880 metric tons.
In 2014 Canada’s blueberry supply surpassed Argentina’s imports; the same year, Chile’s shipments fell to 24 percent, down from 33 percent in 2011. At the same time, the United States increased its market participation from 55 to 61 percent, with robust domestic harvests and the dropoff in Chilean production.
In 2016 Mexico expanded its market penetration to become the third most important supplier, sending 13,938 metric tons to the United States, but representing only 5 percent of the overall market.
For 2017 the top suppliers were the United States with 104,709 metric tons and a market share of 48 percent, and Chile, representing 23 percent, though its production contracted from 70,254 metric tons the previous year to 50,090 metric tons.
Mexico posted significant gains for 2017 with production rising 56 percent and exports hitting 21,883 metric tons for the year, representing an annual average growth rate of 50 percent since 2011. Although Mexico ships almost all year, its peak shipping months are from March to May.
These months have shown extraordinary growth: up 77 percent from the 2015-16 season to 2016-17. In the first months of 2018, Mexico’s output rose 42 percent from 2017 and this surge is expected to continue.
Another emerging player, Peru, competes with Argentina from October to November and Chile in December and January. Initially, Peru began with very low participation and market share in 2011 but began gaining traction in 2012, then experienced skyrocketing growth by the 2015-16 season, up 67 percent.
Peru exports surpassed Argentina in the 2015-16 season by 10 percent, at a time when Argentina claimed a 15 percent share of the export market (which has now fallen to 9 percent). More astonishing is Peru’s 2017 output—up 54 percent from 2016’s stellar numbers.
Peru now ships 17 percent more blueberries than Canada to the United States in a year. Canada, which competes with the U.S.’s domestic demand, had reduced supply for the 2016 season (17 percent), but returned with a 26 percent increase in 2017 at 14,746 metric tons, representing 12 percent of the 2017-18 U.S.’s import market.
Monica Gallo Riofrio earned an MBA from INCAE in Costa Rica and previously served as a price analyst. She is an agribusiness consultant and contributes her expertise to executive education programs.


